
In this Module, we shall talk about Intermarket Analysis and Sector Rotation. Up until now, we have primarily talked about asset classes individually. We have thoroughly covered currencies, commodities, and stocks in our earlier modules. Now is the time to combine the four primary asset classes that are traded in the market. These four asset classes include currencies, commodities, bonds, and stocks. Combining the four adds a new dimension to analysisand enables one to get a more holistic picture of the overall markets.It also helps a trader to understand the business cycle better, which in turn can play an important role when it comes to understanding and deploying sector rotation strategies.
In this chapter, we shall introduce the four asset classes that we will be talking about throughout this module. These four asset classes include currencies, commodities, bonds, and stocks. We shall conclude this chapter by highlighting the importance of Intermarket Analysis and explain why every trader/investor must pay attention to the price action and the trends of each of these asset classes.
Before we get started with this module and chapter, let me add an important disclaimer. This module will talk in detail about different asset classes and their influence on one another. Also, in this module, we will rely quite a lot of charting. Because of all these, it is assumed that the reader understands currencies, commodities, stocks, and technical analysis. If not, we would highly recommend reading each of these modules first from our School of Stocks portal, before coming back to this module. With that, let us get started with the exciting world of Intermarket Analysis and Sector Rotation.
Currencies
There are several currencies that are traded around the world. As per the United Nations, there are 180 currencies at present. While most of the nations have their own currency, a few do not and hence use foreign currency for transacting. Then there are a few nations that use a common currency among them. As a result, the total number of recognized currencies are slightly less than the total number of countries around the world.That said, 180 is still a big number. You might ask ‘do I need to keep a track of these many currencies?’. The answer is no. Although there are 180 currencies, you need to track only a handful of them. The most important currencies are the ones that are a part of the Majors group, the key Crosses group, and the BRICS currencies.
If you remember from our discussion in the Currencies module, currencies are always expressed in pairs and not in isolation. That is a currency of one country is expressed against a currency of the other country. The currency that appears in the numerator is called the base currency (aka home currency), while the currency that appears in the denominator is called the quoted currency. For instance, in the pair USD/INR, USD is the base currency while INR is the quoted currency. This quote tells how many units of the quoted currency are needed to buy one unit of the base currency. For instance, if USD/INR = 75.00, it means 1 USD = 75 INR and you need 75 rupees to buy 1 dollar.
| The Major pairs | The Cross pairs | The BRICS pairs |
| EUR/USD | EUR/GBP | USD/INR |
| GBP/USD | EUR/CHF | USD/CNY |
| USD/JPY | EUR/JPY | USD/BRL |
| USD/CHF | GBP/JPY | USD/RUB |
| AUD/USD | AUD/JPY | USD/ZAR |
| USD/CAD |
The above table shows 16 of the most important currency pairs. Within these, if one needs to filter out a few pairs, the Crosses could be skipped. The Majors and the BRICS pairs, however, are quite important to keep an eye on periodically.
A common question that you might ask is ‘Is there an index that lets one understand the trend of the currency market in general?’. The good news is there is one: The Dollar Index, commonly abbreviated as the DXY Index.The DXY Index is a trade-weighted basket that tracks the performance of the Dollar against six major currencies namely the Euro (EUR), the Japanese Yen (JPY), the British Pound (GBP), the Canadian Dollar (CAD), the Swedish Krona (SEK), and the Swiss Franc (CHF). Below mentioned are the weights of each of these currencies against the US Dollar in the DXY Index.
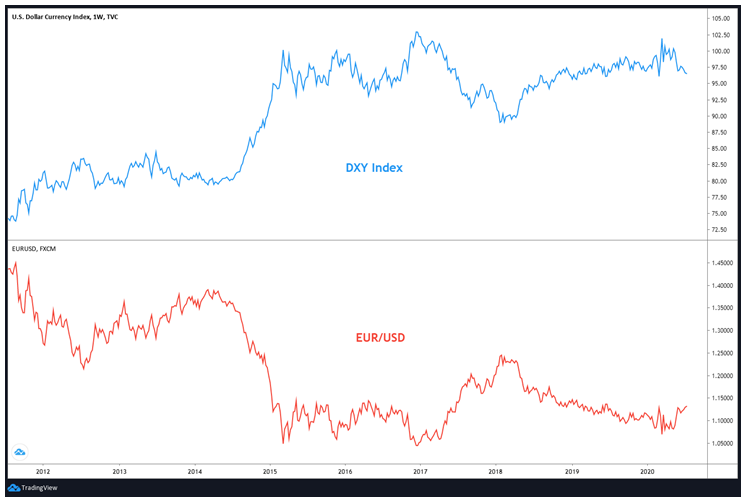
As we can see from the pie diagram above, the Euro occupies nearly three-fifths of the weight in the DXY Index. Hence, the DXY Index is heavily influenced by the trajectory of the EUR/USD currency pair. The chart below compares the DXY Index with EUR/USD.
Notice in the above chart how the DXY Index and the EUR/USD look like mirror images of oneanother. See that they tend to move in the opposite direction and that a top in one usually coincides with a bottom in the other, and vice versa. Again, the reason why this happens is because the Euro occupies a lion’s share in the DXY Index. Hence, movement in the DXY is heavily influenced by movements in EUR/USD. A strengthening DXY index usually implies EUR/USD is weakening, and vice versa.
The Dollar is the world’s reserve currency as well as the most traded currency in the world. In fact, as per a report released by the Bank for International Settlements (BIS) in 2019, the dollar is on one side of 88% of all trades. Such is the global dominance of the dollar. Moreover, the dollar is also used to price several international assets, such as commodities. Because of all these factors, the dollar’s trajectory tells a lot about the general trajectory of the global currency market. In other words, a strengthening dollar means other currencies, in general, are weakening, and vice versa. And as we said earlier, the best and the most tracked proxy for measuring the dollar’s relative performanceversus other currencies is the DXY Index. For our work on intermarket analysis throughout this module, whenever we will refer to currencies, we shall primarily focus on the DXY Index.
Commodities
Commodities are hard-assets because of their tangible nature. They are also one of the most important asset classes because of their utility in our day to day lives. Commodities can broadly be classified into four groups. These are as mentioned below:
- Precious metals
- Industrial metals
- Energy
- Agriculture
Precious metals include gold, silver, platinum, and palladium. Industrial metals can be sub-divided into two groups: ferrous and non-ferrous metals. Ferrous metals include steel and iron whereas non-ferrous metals include copper, aluminium, zinc, lead, nickel, brass, and tin. Energy commodities include crude oil, natural gas, gasoline, and heating oil. Finally, agricultural commodities include soybeans, wheat, rice, corn, sugar, cotton, livestock etc.
Commodityprice movements can and do have repercussions across all the other assetclasses. They are one of the key drivers of price pressure (inflation/deflation) in any economy and as such, their price swings are closely monitored by monetary authorities and by governments across the world. At the same time, trends in commodities tell a lot about the health and the well-being of the world economy as well. Because of these factors, commodities are an extremely important asset-class to keep a track of. Commodities play a major role in influencing the intermarket trends.
There are three ways of tracking commodities. One is to track them individually, such as tracking gold, copper, crude oil, etc. Doing so enables one to understand what is happening in each individual commodity. The other is to track sectoral commodity indices, such as precious metals index, base metals index, etc. Doing so enables one to understand what is happening in each commodity group. The third is to track all commodities in entirety as one group, such as a commodity index. Doing so enables one to understand what is happening among commodities, in general.
Individually, there are several commodities that are traded in the markets. However, it is not necessary to monitor every single one of them. One could, as an example, look at just one key commodity from one particular commodity group. For instance, one could track gold from the precious metals segment, crude oil from the energy segment, and so on. Below mentioned are some of the most important commodities from each segment that one needs to monitor frequently:
- Precious metals segment: Gold
- Industrial metals segment: Copper
- Energy segment: Crude oil
- Agricultural segment: Soybean, corn
Gold, copper, and crude oil in particular are three of the most traded and the most eyed commodities of all. Their trends can say various things about the global economy and the prevailing risk flows. For instance, a rising trend of gold (a safe haven asset) and a falling trend of copper (an industrial commodity) could suggest that market is in a risk-off mode and that global economic conditions could be deteriorating, and so on. If a trader or an investor cannot monitor the trends of multiple commodities, then the trends of at least these three must be monitored frequently.
The chart above compares the trend of Brent crude oil and that of gold. Notice the marked arrow. During this period, crude oil plunged as Covid-19 outbreak and the subsequent global lockdowns drastically reduced global demand for oil. On the other hand, gold prices shone during this period as investors dumped risky assets and sought refuge in the safety of gold. Over the last few weeks, notice that the two have moved in tandem as lockdown relaxations coupled with production cuts from the OPEC have helped ease the global oil supply glut, while monetary easing by the Fed and other central banks have continued to boost gold prices.
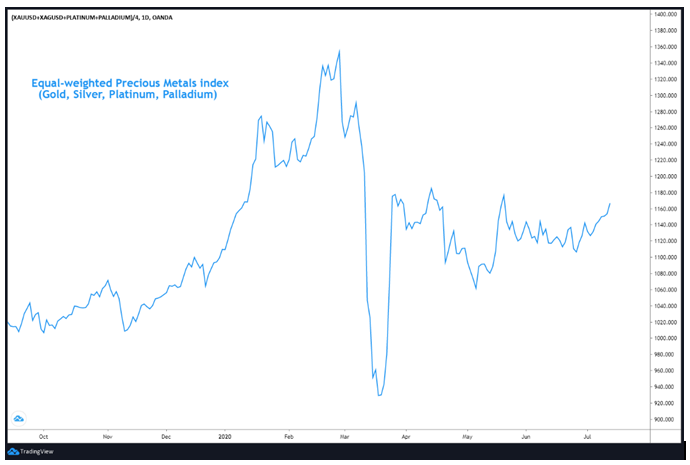
The above chart is an equal weighted chart of precious metals, which includes gold, silver, platinum, and palladium. This equal-weighted chart shows the trend of precious metals as a group. The chart shows that precious metals as a group traded strong for the first three months of 2020, plunged in April to wipe out all of the early year gains, before recovering half of the losses since May. One could also assign weights to each precious metal in the group, giving the highest weight to the most important metal and the lowest to the least important metal.
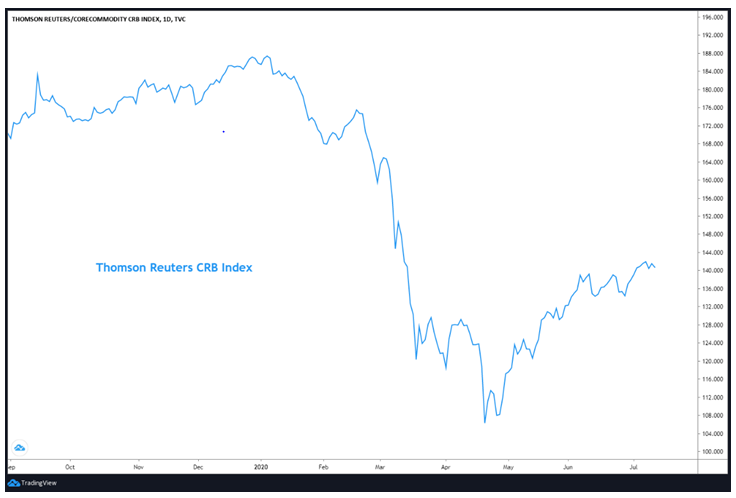
The above chart is of Thomson Reuters (now Refinitiv) Core Commodity CRB index. This index monitors the performance of commodities, in general, and comprises of 19 commodities from different groups. These commodities along with their current weights (as of July 2020) are mentioned below:
| Commodity | Group | Weights |
| WTI Crude oil | Energy | 23% |
| Natural Gas | Energy | 6% |
| Gold | Precious Metals | 6% |
| Copper | Industrial Metals | 6% |
| Aluminium | Industrial Metals | 6% |
| Corn | Agriculture | 6% |
| Soybeans | Agriculture | 6% |
| Live Cattle | Agriculture | 6% |
| Heating Oil | Energy | 5% |
| Unleaded Gas | Energy | 5% |
| Sugar | Agriculture | 5% |
| Cotton | Agriculture | 5% |
| Cocoa | Agriculture | 5% |
| Coffee | Agriculture | 5% |
| Silver | Precious Metals | 1% |
| Nickel | Industrial Metals | 1% |
| Wheat | Agriculture | 1% |
| Lean Hogs | Agriculture | 1% |
| Orange Juice | Agriculture | 1% |
The table above shows the weights of individual commodities in the Core CRB index. It can be seen that out of 19 commodities, WTI Crude oil occupies a weight of nearly 25%. Because of a greater weightage given to crude oil, the core CRB index is quite sensitive to fluctuations in the price of oil. Also, it can be seen that out of 19 commodities, 4 belong to the energy group, 2 to the precious metals group, 3 to the industrial metals group, and 10 to the agricultural group.
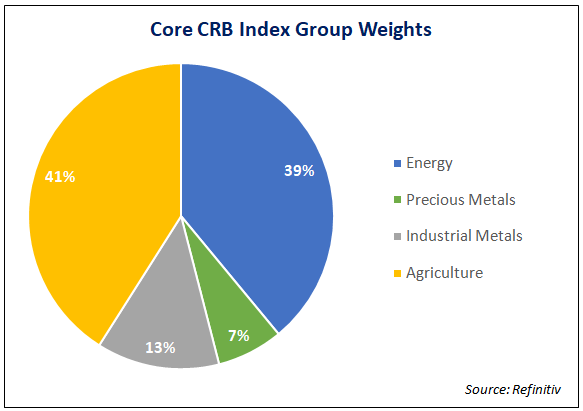
The pie chart above shows the group-wise commodity weightings in the CRB index. It can be seen that the agriculture and energy group have nearly identical weightings and account for 80% of the total index weight. The rest 20% belongs to the metals space. Kindly keep in mind that the composition and weightings of the CRB index can and do change over time.
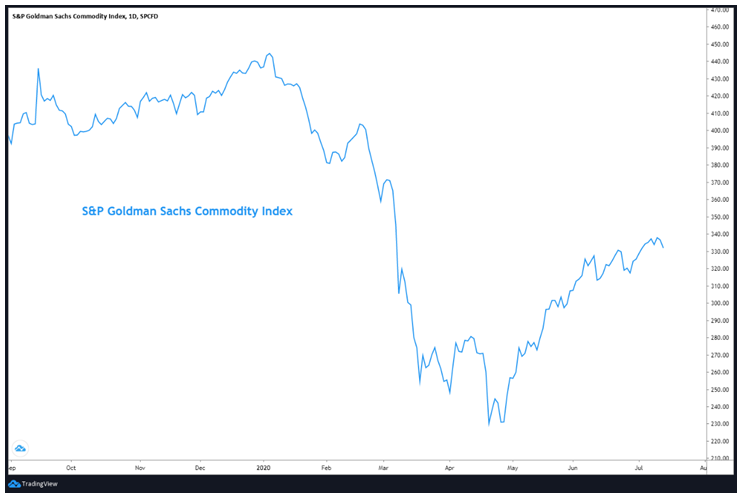
The above chart is that of S&P Goldman Sachs Commodity index (GSCI). This index monitors the performance of commodities, in general, and comprises of 24 commodities from different groups. These commodities along with their current weights (as of July 2020) are as mentioned below:
| Commodity | Group | Weights |
| WTI Crude oil | Energy | 25.31% |
| Brent Crude oil | Energy | 18.41% |
| RBOB Gasoline | Energy | 4.53% |
| Heating Oil | Energy | 4.27% |
| Gasoil | Energy | 5.95% |
| Natural Gas | Energy | 3.24% |
| LME Aluminium | Industrial Metals | 3.69% |
| LME Copper | Industrial Metals | 4.36% |
| LME Lead | Industrial Metals | 0.68% |
| LME Nickel | Industrial Metals | 0.80% |
| LME Zinc | Industrial Metals | 1.12% |
| Gold | Precious Metals | 4.08% |
| Silver | Precious Metals | 0.42% |
| Chicago Wheat | Agriculture | 2.85% |
| Kansas Wheat | Agriculture | 1.25% |
| Corn | Agriculture | 4.90% |
| Soybeans | Agriculture | 3.11% |
| Cotton | Agriculture | 1.26% |
| Sugar | Agriculture | 1.52% |
| Coffee | Agriculture | 0.65% |
| Cocoa | Agriculture | 0.34% |
| Live Cattle | Agriculture | 3.90% |
| Feeder Cattle | Agriculture | 1.30% |
| Lean hogs | Agriculture | 2.06% |
The table above shows the weights of individual commodities in S&P GSCI. It can be seen that out of 24 commodities, Crude oil (WTI + Brent) occupies a weight of 44%. Because of such a significant weightage given to crude oil, S&P GSCI is extremely sensitive to fluctuations in the price of oil. Also, it can be seen that out of 24 commodities, 6 belong to the energy group, 2 to the precious metals group, 5 to the industrial metals group, and 11 to the agricultural group.
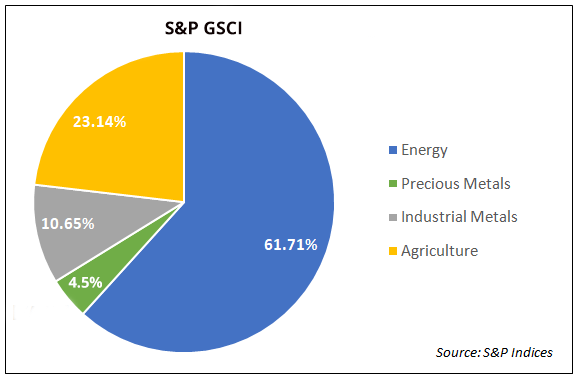
The pie chart above shows the group-wise commodity weightings in S&P GSCI. It can be seen that the energy group accounts for over 60% of the total index weight, while the agriculture group accountsfor just under 25%. Because of the greater weightings assigned to the energy group, S&P GSCI tends to be extremely sensitive to trends in the energy market. Meanwhile, the rest 15% belongs to the metals space. Kindly note that the composition and the weightings of S&P GSCI can and do change over time.
Besides the CRB index and S&P GSCI, there are various other commodity indices including group-wise commodity indices, which we shall discuss occasionally when talking about commodities from an intermarket perspective. However, for most of our discussion on intermarket linkages, whenever we speak of commodities, we will mostly talk from the viewpoint of the Core CRB index and S&P GSCI, as these two arethe most-widely tracked commodity indices in the world while also being considered as global benchmarks for tracking the trends of commodities in general.
Bonds
Bonds are financial instruments that are issued by governments, municipalities, and corporations (who are known as the borrowers or the issuers) to raise capital in order to fund their financial needs. They are issued for a certain period of time (ranging from a few months, in which case they are usually called bills, to several years, in which case they are usually called bonds) during which they pay periodic coupons to the holders of these instruments (who are known as the lenders or the bondholders). Bonds are usually issued at face value (aka par value). At maturity, the face value of the bond is repaid in full to bondholders. Meanwhile, the periodic coupons are interest paid by the borrower to the lender for lending money for a certain period of time. Because bonds pay periodic coupons, they are also known as fixed-income instruments. The rate at which a bond is issued is called the coupon rate, which is also known as the yield of the bond at the time of issuance. The coupon rate is expressed as anannualized percentage of the face value of a bond.
When an issuer first issues a bond, the issuance is done in the primary market. The place where already issued bonds are available for trading is the secondary market. Several government, municipal, and corporate bonds are publicly traded in the secondary markets. If a bond is publicly traded, an investor need not necessarily buy the bond from the issuer. Instead, he or she could buy it from the secondary market where it is traded. Also, an investor could sell the bond in the secondary market anytime up to its maturity, just like he or she could buy it in the secondary market any time after its issuance. Buying and selling in publicly-traded bonds is as similar to buying and selling in publicly-traded stocks. Meanwhile, while the face value of bonds remains fixed, their market value keeps changing depending upon several factors.The most important factors that influence the market price of a bond are the coupon rate versus the interest rate in the economy, credit worthiness of the issuer, and time to maturity of the bond.At any point in time, the market value of a bond could be below, equal to, or above its face value.
The objective of discussing bonds in this module is not to cover the fundamentals of bond markets in detail. That is far outside the purview of this module. Instead, the objective of discussing bonds is to understand their role in the intermarket landscape. In order to understand this, we must first understand the crucial role that interest rates play in influencing bond prices and then understand the correlation between bond price and its yield. So, let us get started. Keep in mind that for the rest of our discussion on bonds, we will be talking about publicly-traded bonds only.
Impact of interest rates on bond prices
One of the major factors that impact publicly-traded bond prices are interest rates in the economy. As interest rates change, so does the market price of bonds. Let us take a simple example. Let us say that a bond has a coupon rate of 5% and the prevailing interest rate in the economy is also 5%. Going forward, if interest ratesin the economy rise above 5%, new bonds that would be issued in future would be issued at higher coupon rates. As a result, demand for the existingbond that was issued at a coupon rate of 5% will decline due to the lower rate it offers over the market rate. Because of this, to maintain the attractiveness of the existing bond, the market price of that bond will decline by an amount that would compensate for the given rise in interest rate. On the other hand, if interest rates in the economy drop below 5%, new bonds that would be issued in future would usually be issued at lower coupon rates. As a result, demand for the existing bond that was issued at a coupon rate of 5% will increase due to the higher rate it offers over the market rate. Because of this, the market price of that bond will increaseby an amount that would compensate for the given drop in interest rate. It is for this reason that the market price of a bond moves inversely with interest rates. That is, bond prices fall when interest rates rise, and vice versa.
Inverse correlation between bond price and bond yield
Now that we understand the correlation between bond price and interest rates, it is time to talk about the correlation between bond price and bond yield. But what exactly is bond yield? Put it in simple words, bond yield is the annualreturn an investor would earn on the bond. The yield on a bond can be calculated as follows:
Note that in the above expression, annual coupon is expressed in value terms. Depending upon the demand and supply for a bond in the market, the market price of a bond keeps changing. On the other hand, the annual coupon (in value terms) usually remains fixed over the life of the bond. As a result, the bond yield keeps changing as the market price of the bond changes. As the market price of a bond keeps changing, at any point in time, the bond could be trading below, at, or above its face value. If the market price of a bond is below its face value, the bond is trading at a discount, in which case its current yield will be above the coupon rate.Similarly, if the market price of a bond is equalto its face value, the bond is trading at par, in which case its current yield will be equal to the coupon rate. Finally, ifthe market price of a bond is above its face value, the bond is trading at a premium, in which case its current yield will be below the coupon rate. Let us understand this using a simple example.
Let us say that a bond has a face value of ₹100, a coupon rate of 6%, a maturity period of 10 years, and a coupon that is payable semi-annually. This means the annual coupon of ₹6 would be paid in two parts each year, each part being ₹3.
What would be the current yield if the market price of the bond rises to ₹105? Let us calculate this using the above mentioned equation:
On the other hand, what would be the current yield if the market price of the bond falls to ₹90?
Notice above that as the market price of a bond rose above the face value of ₹100, the current yield fell below the coupon rate of 6%, and vice versa.From this, we can see that there is an inverse correlation between bond price and bond yield. That is, as bond price rises, bond yield falls, and vice versa.
From this, we can see that there is an inverse correlation between bond price and bond yield. That is, as bond price rises, bond yield falls, and vice versa.
Combining bond price, bond yield, and interest rate
From the above discussion on bonds, as far as intermarket analysis is concerned, there are three important properties that must be memorized and kept in mind. These are:
- Interest rates and bond prices are inversely correlated
- Bond prices and bond yields are inversely correlated
- Interest rates and bond yields are directly correlated
Hence, in an environment where interest rates in the economy are rising or as expected to rise, bond yields trend higher while bond prices trend lower. Similarly, in an environment where interest rates in the economy are falling or are expected to fall, bond yields trend lower while bond prices trend higher. This is applicable for both government bonds as well as corporate bonds.
Categories of bonds based on their maturity period
Generally speaking, bonds could be split into three categories depending on their maturity period. These are as mentioned below:
- Bills – these have maturity of less than a year and are issued to raise short-term capital. Examples include 3-month (or 91-day) bills and 6-month (or 182-day) bills
- Notes – these have maturity of more than 1 year but less than 10 years and are issued to raise capital for the medium-to-long-term. Examples include 2-year note and 10-year note
- Bonds – these have maturity of more than 10 years and are issued to raise capital for the long-term. Examples include the 30-year bond
The above mentioned are the standard norms in the US. Some countries don’t distinguish between notes and bonds. Instead, they call any fixed-income instruments having maturity of more than 1 year as bonds.
Generally speaking, the longer the maturity periodof a fixed-income security, the higher would itsyield be, and vice versa.For instance, the yield of a 10-year Treasury note would usually be higher than that of a 2-year Treasury note of the same country. Also, the shorter the maturity period of a fixed-income security, the more sensitive will its yield be to changes in interest rates in the economy, and vice versa. For instance, the yield of a 2-year Treasury note will be more sensitive to changes in interest rates than that of a 10-year Treasury note.
Inflation-linked bonds
The bonds that we have discussed so far are bonds that offer nominal interest rates. That is, these bonds do not take into consideration the prevailing level of inflation in the economy. Inflation, as you know, dampens the real rate of return that is earned on any investment. For instance, let us say that I invest ₹100 today in a 1-year debt instrument having a yield of 5%. At the end of 1 year, I would get back my principle of ₹100 along with an interest of ₹5, which would be my return on investment. However, what if the prevailing inflation rate in the economy is 3%. In that case, the value of ₹100 today would be equivalent to ₹103 a year down the line. That is, the purchasing power of money has reduced over a 1 year period due to the effects of inflation. So effectively, although I am getting a nominal return of 5% on the debt instrument, the real return would just be around 2%, after taking into consideration the inflation rate of 3%. Sometimes, it can also happen that the inflation rate rises above the nominal rate, in which case the real rate of return would turn negative. This is a really bad situation to be in!
Inflation-linked bonds help to address such inflation-related risks. They are usually linked to a key measure of inflation in an economy, such as the Consumer Price Index (CPI).From our prior discussion on bonds, we know that the face value of a bond and its coupon rate remain unchanged throughout the bond’s tenure and that the coupons are paid as a certain percent of the face value of the bond. Even in case of an Inflation-linked bond, the coupon rate remains unchanged throughout the bond’s tenure and the coupons are paid as a certain percent of the face value of the bond. However, there are two factors that separate a nominal bond from an Inflation-linked bond. These are:
- In an Inflation-linked bond, the face value of the bond is adjusted for inflation. That is, as inflation in an economy rises, the face value of an inflation-linked bond also rises.
- Also, in an Inflation-linked bond, coupon is paid on the adjusted face value of the bond. So, if the face value of the bond rises, so does the coupon that is paid to the bondholder.
So, as we can see, in an environment where inflation is rising, the face value of an Inflation-linked bond will be adjusted higher, because of which investors would receive higher coupons. However, there is a catch to this. What if an economy experiences deflation (i.e. negative inflation)? In that case, the face value of an Inflation-linked bond will be adjusted lower, because of which investors would receive lower coupons.If the adjusted face value is below the original face value of the bond at maturity, will investors get lower principle proceeds at maturity? Well, the answer is no. In most cases, at maturity, the holders of an Inflation-adjusted bond would receive an amount equivalent to the adjusted face value or the original face value, whichever is higher. So, the lowest possible principle proceed that the investor would receive at maturity is the original face value of the bond. Let us understand this using a few examples:
Let us say that an Inflation-linked bond has a face value of ₹100, a coupon rate of 4%, and a maturity period of 10 years. Because this is an Inflation-linked bond, the coupons will vary each period, depending on the inflation rate.
- What coupon would an investor receive if inflation rises by 3% over a year?In this case, the face value would be adjusted higher to ₹103 (₹100 * 1.03). The coupon that the investor would receive would be on the adjusted face value of ₹103. This would amount to ₹4.12 (₹103 * 4%).
- What coupon would an investor receive if there is no inflation over a year? In this case, the face value would stay at ₹100. The coupon that the investor would receive would be on theface value of ₹100. This would amount to ₹4 (₹100 * 4%).
- What coupon would an investor receive if there is a 5% deflation over the year? In this case, the face value would be adjusted lower to ₹95 (₹100 * 0.95). The coupon that the investor would receive would be on the adjusted face value of ₹95. This would amount to ₹3.8 (₹95 * 4%).
Notice above that the coupon rate remains the same. What changes is the adjusted face value depending on the inflation rate, which causes the coupons to vary.
An advantage of Inflation-protected bonds over nominal bonds is that they protect an investor from the adverse impact of rising prices. However, a disadvantage is that they offer a lower coupon rate as compared to that offered by similar-dated nominal bonds. Also, if there not much inflation or, in a worse-case scenario,there is deflation, the investor would end up receiving lower coupons because of lower adjustment done to the face value of such instruments.
Inflation-adjusted bonds are available in a range of maturities, such as 5-year, 10-year etc. In the US, Inflation-adjusted bonds are known as Treasury Inflation Protected Securities, akaTIPS. US TIPS are available in four different maturities, namely 5-year, 10-year, 20-year, and 30-year. Among these, the 10-year TIPS is often considered a benchmark and a proxy of real rate of return. Coupons on US TIPS are paid on a semi-annual basis. Just like nominal bonds, US TIPS are also traded in secondary markets, where buyers and sellers can transact in these instruments any time they wish.
Turning focus back to intermarket analysis
Up until now, we have talked about some key bond-related nomenclature that one needs to know before incorporating bonds into their intermarket analysis. These included understanding the linkages among bond prices, bond yields, and interest rates; understanding the various maturities for which bonds are issued; and understanding the basics of Inflation-adjusted bonds. Now that we are good to go forward, let us proceed and see some charts of bonds.
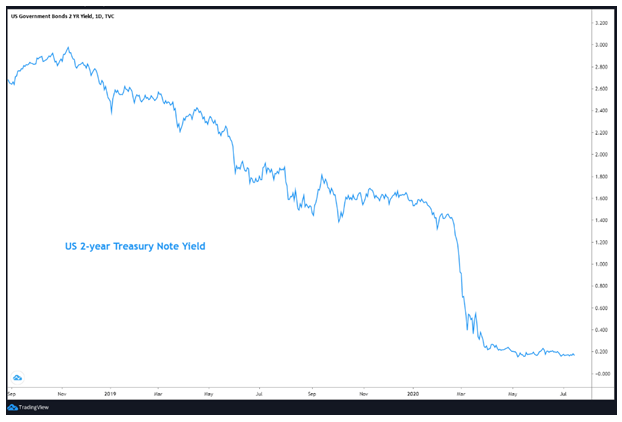
The chart above is the daily chart of the 2-year US Treasury note yield. Observe that the yield has been heading lower for well over a year, which highlights that interest rates, in general, in the US have also been trending lower over the last few months.
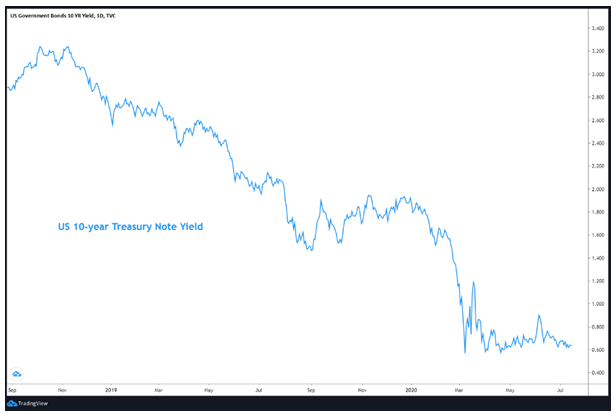
The chart above is the daily chart of the 10-year US Treasury note yield. Observe that just like the 2-year yield, the 10-year yield has also been heading lower for well over a year. In fact, the general trajectory of sovereign bond yields of a nation across maturities tends to be the same.
Going forward, for most of our discussion on intermarket analysis, whenever we shall talk about bonds in this module, we will primarily focuson sovereign bonds, that is bonds that are issued by nations. We shall mostlytalk about US treasury bills (3-month), notes (2-year and 10-year), and bonds(30-year) as well as about US TIPS (10-year). The reason for talking primarily about US bonds is because the US bond market is the largest, most liquid, and most tracked bond market in the world. Also, actions in the US bond markets have strong repercussions not only on US asset classes but also on other asset classes across the world.
Equities
The fourth asset class that forms a part of our intermarket framework is equities (or stocks). We won’t be talking about individual stocks in this module. Rather, we shall talk about some of the key stock indices of the world. The nations whose stock indices we would cover in this module include the US, Germany, Japan, China, India, UK, and Hong Kong. We will also talk about combined equity indices of developed markets and emerging markets. Later on, in this module, we will drill down to sectors within the stock market, where we will lay emphasis on the US and the Indian stock market sectors.
There are hundreds of stock indices in the world. However, it is not possible to track each one of them. Instead, the focus should be the stock indices that are quite important and are widely tracked by market participants around the world. Some of the key indices that we would be talking about in this module are mentioned below, along with the nations to which these indices belong:
| Index | Nation |
| DJIA 30, S&P 500, NASDAQ, Russells 2000 | US |
| DAX 30 | Germany |
| Nikkei 225 | Japan |
| Shanghai Composite | China |
| Nifty 50, Midcap 100, Smallcap 100 | India |
| FTSE 100 | UK |
| Hang Seng | Hong Kong |
| Equal-weighted chart of each nation | BRICS |
| MSCI Index | Emerging Markets |
| MSCI Index | Developed Markets |
| MSCI Index | World Markets |
These are some of the most important indices that one must monitor frequently. As you might be aware, as most markets today are internationally linked, global equity indices tend to move in sync. That is, most tend to rise and fall together, although the relative performance of the index of one nations varies as compared to that of another nation. Take the example of the 2000 dot com crisis or the 2008 global financial crisis. During each of these crises, most of the world markets fell together and subsequently recovered together. Even in the ongoing 2020 Covid-19 crisis, several world markets fell together in February and March 2020, before bottoming out and rebounding together since then. In today’s technology-driven era, the world markets are more closely linked than ever. Hence, it makes sense to keep a track of not just one market that interests you, but all the major markets around the world.
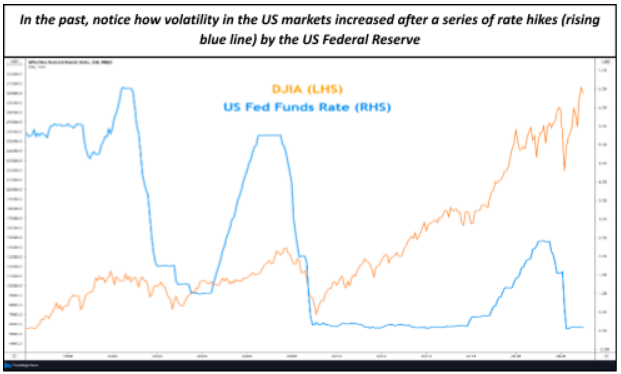
The above is the daily chart of the Dow Jones Industrial Average index (DJIA), which is a price-weighted index that tracks the performance of 30 largecap US stocks. The DJIA is one of the most widely-tracked stock market index in the world and is also one of the oldest stock-market index. Notice in the above chart that after bottoming out near the start of 2019, the index was in a strong uptrend for virtually all year long. However, after peaking out in early-2020, the index registered one of its fastest falls in history, weighted by the Covid-19 crisis and its subsequent impact on the US economy.
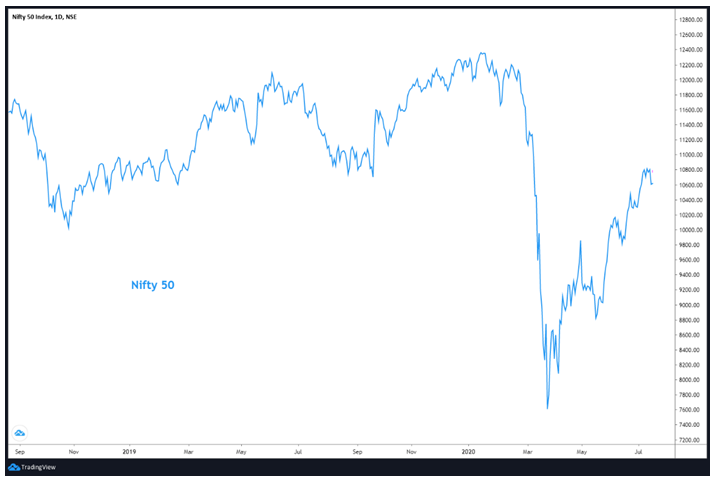
The above is the daily chart of the Nifty 50 index, which is a market-capitalization weighted index that tracks the performance of 50largest Indian stocks. Nifty is often considered the benchmark index of India and is widely tracked by market participants. Notice in the above chart the performance of Nifty. While the relative performance differs, observe that movements in Nifty were quite similar to that of the DJIA shown in the previous chart. This is in line with what we said earlier in this chapter: most of the world equity markets and inter-connected and tend to move in sync with each other.
Importance of understanding intermarket linkages
Broadly speaking, the four asset classes that we shall talk about in this module are currencies, commodities, bonds, and equities. We shall study the relationship between these asset classes and show that the price trend of one asset class has a bearing on that of another asset class. In other words, we shall show that there are correlations between these asset classes and that these must be studied closely. Understanding these correlations and then monitoring them closely on charts can often signal the impact one asset class could have on the price trajectory of another asset class. Knowing and applying these intermarket relationships provide an invaluable additional toolset in a trader’s/investor’s arsenal.Some of the key correlations that we shall study in the upcoming chapters in this module are as mentioned below:
-
Correlation between the dollar and commodities
-
Correlation between the dollar and US interest rates
-
Correlation between one commodity and another
-
Correlation between commodity and bond prices/bond yields
-
Correlation between the dollar and bond prices/bond yields
-
Correlation between bond yields and interest rates
-
Correlation between bond yields and stocks
-
Correlation between interest rates and stocks
-
Correlation between the dollar and stocks
-
Correlation between commodities and stocks
Besides, we shall also study the business cycle and see how these asset classes interact in a business cycle. With that said, it is time to conclude this chapter. In the next chapter, we shall start our intermarket work, wherein we shall study the correlation between the dollar and commodities.
Next Chapter
Comments & Discussions in
FYERS Community




Kalaiselvan commented on August 6th, 2020 at 7:53 AM
Thanks for covering Inter market analysis, this is very helpful and informative..I request you to conduct a webnair if possible on the same
Abhishek Chinchalkar commented on August 6th, 2020 at 8:08 AM
Hi Kalaiselvan, thank you for your valuable feedback. A lot more content would be coming on Intermarket Analysis in the coming days. And yes, we surely will think of conducting a webinar series on Intermarket Analysis in future.
Shreevardhan commented on August 26th, 2020 at 11:37 PM
It was very informative and unique education. Thanks.
Abhishek Chinchalkar commented on August 27th, 2020 at 5:58 PM
Hi Shreevardhan, thank you for your feedback!