In this chapter, we will study the correlation that exists between commodities and bonds and the crucial role that inflation and interest rates play in influencing this correlation. Trends in the commodity and bond market can and do influence the trajectory of the stock market. As such, it ispivotal that one understands the correlation between commodities and bondsat various points in time and then monitorsit periodically on a real time basis.
In the first chapter, we talked about the relationship between bond prices and bond yields. We saw that the two always move in the opposite direction. In this chapter, we will talk about bonds from the perspective of yields rather than prices. Keep in mind that if bond yields, in general,are rising, it means bond pricesare falling, and vice versa. Also keep in mind that when we say a certain type of relationship exists between bond yields and an asset class, it implies an existence of opposite relationship between bond prices and that asset class.
High Inflation and interest rates
Inflation and interest rates are quite correlated to each other. In fact, the latter is used by government officials of a nation as a tool to control the level of inflation in an economy. Generally speaking, inflation is not always a bad thing. In fact, a moderate level of inflation in a growing economy is actually a healthy sign because it indicates rising demand for various goods and services.This boosts employment opportunities and wage rate, which in turn boosts consumer spending. However, too much inflation can pose a threat to economic stability as it reduces the purchasing power of people, hurts savings as real rates reduce, and discourages companies from investing in capital and labour.
The level of inflation in an economy is linked to the level of money supply in that economy. Money supply means the amount of money that is in circulation in an economy. Over the long-term, there is a positive correlation between the two. That is, as the level of money supply in the economy increases, the prices of goods and services, in general, tend to increase. The reason why this happens is because there would too much money chasing a limited amount of goods and services, causing their prices to go up. Meanwhile, the opposite is also true when the level of money supply in the economy reduces.
In an economy, the institute that most influences the level of interest ratesand money supply is the central bank of that economy. One of the major mandates of most central banks around the world is to maintain stable prices (i.e. inflation). To ensure the attainment of this objective, central banks use a tool at their disposal called the monetary policy. Monetary policy helps a central bank to directly influence the level of money supply in the economy, thereby helping it to achieve macroeconomic objectives. At times when inflation rises too much to pose a threat to economic stability, central banks tend to increase their key policy interest rates to tame inflationary pressures. Traditionally, central banks tend to do the following to tackle high inflation in an economy:
- Raise the Repurchase rate: This is the rate at which commercial banks borrow money from the central bank. As the central bank raises the Repurchase rate, the cost of borrowing for commercial banks goes up. Subsequently, commercial banks tend to pass on such higher costs to their customers by raising the interest rates they charge on various types of loans. This in turn makes loans more expensive, which tends to hurt the demand for them and thereby restrict the quantum of money supply in the economy.
- Raise the Reverse Repurchase rate: This is the rate at which commercial banks park their surplus funds with the central bank. As the central bank raises the Reverse Repurchase rate, the incentive to park idle money with the central bank increases because of the higher rate of interest. And as commercial banks park a greater portion of their excess reserves with the central bank, the quantum of money supply in the system reduces.
- Raise the Reserve requirement ratios: This refers to the amount of cash or liquid assets that commercials banks must maintain in hand at all times. During periods of high inflation, the central bank could increase the reserve requirement ratios. Doing so means commercial banks will have to maintain a greater amount of deposits in the form of reserves, thereby reducing the amount of disposable funds that banks could give out as loans. This in turn helps in reducing the amount of money in circulation.
- Sell G-Secs usingOpen market operations: This refers to the purchase and/or sale of government securities (G-Secs) in order to control the level of liquidity in the economy. During times of high inflation, a central bank could sell government securities in the market and in turn suck money from the market, thereby draining excess liquidity from the economy.
By using any or a combination of the above tools, the amount of money in circulation (i.e. the money supply) tends to reduce. And as there would now be fewer money chasing the same amount of goods and services, inflationary pressures gradually tend to decelerate as well.
Let us conclude by highlighting the key learnings from this section:
-
A central bank uses monetary policy at its disposal to influence the level of money supply in the economy
-
When the level of inflation in an economy poses a threat to economic stability, a central bank adopts a contractionary monetary policy
-
In a contractionary monetary policy, central banks increase interest rates/reserve ratios/sell G-Secs with the aim of reducing the level of money supply in the economy
-
As the level of money supply in the economy reduces, consumer and corporate spending tend to reduce and savings tend to go up, leading to slowdown in economic activity and taming in inflationary pressures
Low inflation/deflation and interest rates
In the previous section, we talked about how high inflation affects the level of interest rates in an economy. We saw that when inflation in an economy gets too high to start posing a threat to economic stability, the central bank of that nation would adopt a contractionary monetary policy to cool down the economy and reduce inflationary pressures. Let us reverse the role now. What if the level of inflation in an economy gets too low or what if the economy experiences a deflation? We shall discuss about that in this section.
We know that inflation is a situation in which the prices of goods and services in an economy are rising. If the rise in the prices of goods and services in an economy is occurring at a slower, or decelerating, rate, the situation is called disinflation. On the other hand, if prices of goods and services in an economy are declining, the situation is called deflation.
When an economy flirts with deflation (too low an inflation) or falls into a deflation, there can be a reduction in consumer spending on anticipation that goods and services will get more cheaper going forward. This in turn can hamper businesses, reduce capital expenditure, reduce wages, and increase unemployment. Deflation also tends to tighten the money supply by increasing real interest rates, which encourages consumers and businesses to save more. Subsequently, reduced spending from consumers and businesses will take a heavy toll on the economy. As such, when inflation gets too low or when an economy falls into a deflationary spiral, the central bank of a country that experiences such a situation tends to aggressively decrease their key policy interest rates to try and get the economy out of the deflationary spiral. If there is limited room to lower interest rates or if conventional policy measures are not having the desired effect on the economy, central banks could also resort to unconventional policy measures such as printing money and increasing the monetary base. Central banks tend to do the following to tackle very low inflation/deflation in an economy:
- Lower the Repurchase rate: As the central bank lowers the Repurchase rate, the cost of borrowing for commercial banks reduces. Subsequently, commercial banks tend to pass on such lower costs to their customers by reducing the interest rates they charge on various types of loans. This in turn makes loans attractive, which tends to boost the demand for them and thereby increase the quantum of money supply in the economy.
- Lower the Reverse Repurchase rate: As the central bank lowers the Reverse Repurchase rate, the incentive to park idle money with the central bank reduces because of the lower rate of interest. And as commercial banks park less of their excess reserves with the central bank, there would be a greater quantum of money supply to give out as loans, thereby boosting money supply in the economy.
- Lower the Reserve requirement ratios: During periods of very low inflation/deflation, the central bank could reduce the reserve requirement ratios. Doing so means commercial banks will have to maintain a smaller amount of deposits in the form of reserves, thereby increasing the amount of disposable funds that banks could give out as loans. This in turn helps in increasing the amount of money in circulation.
- Purchase G-Secs using Open market operations: During times of very low inflation/deflation, a central bank could purchase government securities in the market and in turn issue currency, thereby increasing liquidity in the economy.
- Print money: Central banks could also print money and infuse it into the economy by purchasing G-secs as well as other short-term and long-term securities from commercial banks and other entities. This expands the amount of money that such institutions have at their disposal, which they can then utilize to issue loans to consumers and businesses. Furthermore, by buying long-term G-Secs and other securities, the yields on such instruments go down, which tends to lower long-term interest rates as well. All this in turn helps to boosts the level of liquidity and money supply in the economy.
By using any or a combination of the above tools, the amount of money in circulation tends to increase. As short-term and long-term loans become cheaper, consumer and corporate borrowings tend to increase, thereby aiding in getting the economy kickstarted again. And as the economy kickstarts, deflationary pressures tend to reduce.
Let us conclude by highlighting the key learnings from this section:
-
When the level of inflation in an economy is too low or if deflationary forces are mounting, a central bank adopts an expansionary monetary policy
-
In an expansionary monetary policy, central banks reduce interest rates/reserve ratios/buy G-Secs/print money with the aim of increasing the level of money supply in the economy
-
As the level of money supply in the economy increases, the cost of borrowing reduces. This boosts consumer and corporate spending and reduces the incentive to save, thereby leading to a pickup in economic activity and reduction in deflationary pressures
Targeting the ideal inflation rate
Several central banks around the world set a specific target level for inflation rate in their economy. The RBI aims to keep inflation, as measured by the Consumer Price Index (CPI), within a range of 2% and 6% with a target level of 4%. What this means is the RBI would prefer the annual CPI rate to be close to 4%. If the annualized CPI consistently prints above the upper comfort zone of 6% for a few months, it would be a cause of concern for the RBI and would increase market expectations of interest rates hikes from the RBI. Similarly, if the annualized CPI consistently prints below the lower comfort zone of 2% for a few months, it will increase market expectations of interest rates cuts from the RBI. Meanwhile the US Federal Reserve targets to keep the inflation rate, as measured by the Personal Consumption Expenditure(PCE), at 2%.
In conclusion, the level of inflation in an economy has a strong bearing on the level of interest rates in that economy. During times of high inflation, interest rates tend to go up. On the other hand, during times of very low inflation or deflation, interest rates tend to go down.
You might be wondering is this really important to understand. The answer is yes. Inflation influences the trajectory of interest rates. And expectations of the future trajectory of interest rates have a strong bearing on bond yields/prices. Also, commodity prices often act as a good indicator of inflation in the economy. Hence, the direction in which commodity prices are heading can tell a lot about how inflation could be panning out. In the coming sections, we shall study more about this.
Correlation between commodities and interest rates
As said above, commodities often tend to act as astrong indicator of inflationary trends. Rising commodity prices are usually followed by a rise in inflationary pressures, while falling commodity prices are usually followed by a decline in inflationary pressures. In other words, commodity prices share a positive correlation with the rate of inflation. The reason why this happens is because of the usage of commodities as raw materials in the production of goods and products as well as in their transportation from one place to another. Take the example of crude oil. Crude oil is a crucial commodity that is used as a fuel in the manufacturing of various goods and products, is used for power generation, is used for heating etc. Besides, the various products of crude oil such as petrol, diesel, and jet fuel are used as fuel in vehicles, trains, ships, planes etc., which transport goods and products from one place to another. As such, if there is a steady increase in the price of crude oil, the cost of manufacturing and transportation will increase. The producers, in turn, could pass on these higher costs to consumers, which in turn could fuel inflation. The opposite is also true when there is a steady drop in the price of crude oil, which in turn could fuel disinflation.
The above chart compares annualized change in consumer inflation in the US (LHS, blue line), as measured by the CPI, with the price of Brent crude oil (RHS, red line) since the late 1980s. It can be seen that the two mostly trend in the same direction. That is, periods when oil prices steadily rise are accompanied by increase in inflationary pressures, while periods when oil prices steadily drop are accompanied by decrease in inflationary pressures.
So far in this section, we have seen that rising commodity prices are inflationary, while falling commodity prices are disinflationary. Meanwhile, in the previous section, we saw that during periods of high inflation, central banks tend to increase interest rates, while during periods of low inflation or deflation, central banks tend to decrease interest rates. From this, we can say that:
-
Because a steady rise in commodity prices is inflationary, periods when commodity prices are steadily climbing are usually accompanied by rising interest rates
-
Because a steady decline in commodity prices is disinflationary/deflationary, periods when commodity prices are steadily declining are usually accompanied by falling interest rates
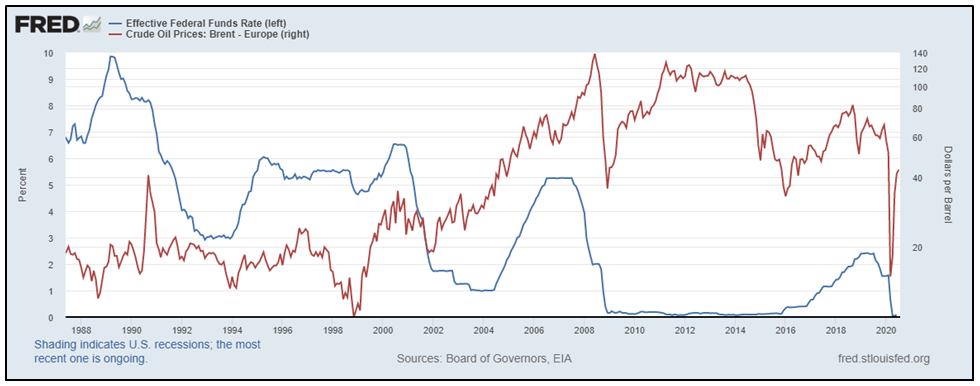
The above chart compares the Effective Federal Funds rate (LHS, blue line) with the price of Brent crude oil (RHS, red line). It can be seen that during periods when oil prices are strengthening, interest rates in the US generally tend to move higher because of the inflationary impact of rising oil prices. Similarly, periods when oil prices are weakening tend to give room to central banks to cut interest rates as inflationary pressures recede. Having said that, keep in mind that inflation plays an important role in influencing the trajectory of interest rates. If rising (falling) oil prices are not fuelling in inflationary (disinflationary) pressures because of other factors that are in play at that point in time, then interest rates are unlikely to move higher (lower). For instance, notice that from late-2000 to mid-2004, oil prices rose while interest rates in the US fell. The reason why rising oil prices did not cause interest rates to move higher during this periodwas because it did not have much impact on inflation. Also, during this period, the US was battling the dot com bubble crisis and recession, both of which nullified the impact of rising crude oil prices and pushed US interest rates lower. As such, keep in mind that commodities influence the trajectory of interest rates only when movements in commodities are strongly influencing the trends in inflation. Also, if there are other bigger factors that are at play, then commodity prices may not have much of an impact on the trajectory of interest rates.
Correlation between bond yields and interest rates
In the previous chapter, we said that bond yields and interest rates are directly correlated. That is, rising interest rates cause bond yields to go up, while falling interest rates cause bond yields to soften. That said, keep in mind that markets are forward looking. Often, central banks around the world give indications about the stance of their future monetary policy well ahead of time. As such, bond yields tend to anticipate changes in interest rates well ahead of time. If markets anticipate interest rates to rise in future, bond yields will start rising well ahead of time. Similarly, if markets anticipate interest rates to fall in future, bond yields will start falling on such expectations.
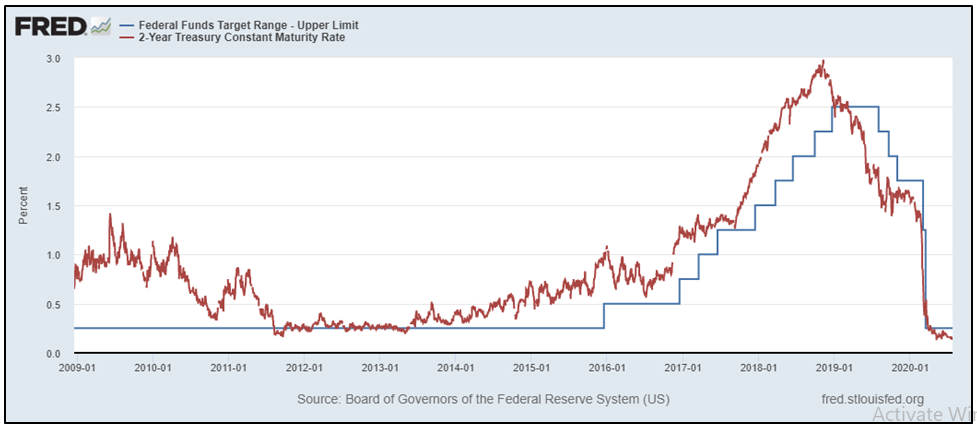
The above chart compares the Fed Funds rate (blue line) with the 2-year US Treasury yield (red line) over the past one decade. Notice above that markets started pricing in the likelihood of higher interest rates well ahead of time. In fact, see that the first rate hike following the 2008 global financial crisis occurred in December 2015, whereas the 2-year yield started rising from January 2014 in anticipation of higher interest rates. Similarly, observe that markets started pricing in the likelihood of lower interest rates from January 2019, whereas the first rate cut by the Fed occurred only 6 months later.
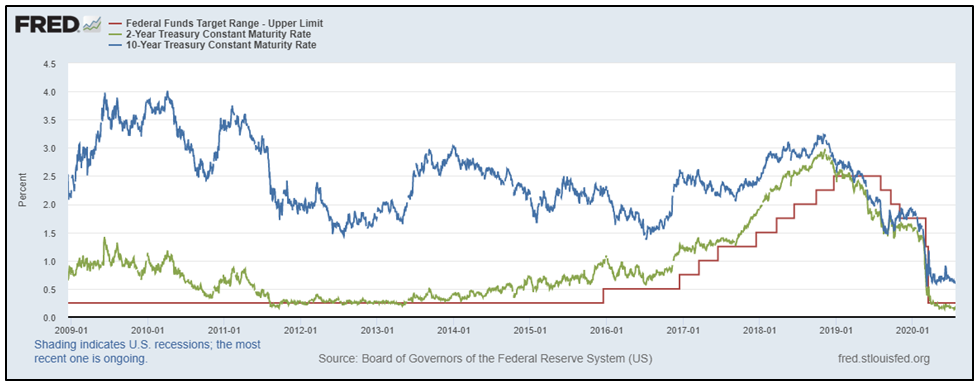
The above chart compares the Fed Funds rate (red line) with the 2-year US Treasury yield (green line) and the 10-year US Treasury yield (blue line) over the past one decade.An important thing to keep in mind is that short-term yields are more sensitive to interest rates than are long-term yields, which are more sensitive to long-term inflation expectations. For instance, notice in the chart above that the 2-year yield started pricing in the likelihood of interest rate increases in the US almost 2 years ahead of the first rate hike by the Fed in December 2015. On the other hand, see that the 10-year yield continued declining during this period and bottomed out almost 6 months after the first rate hike. Subdued long-term inflationary expectations amid declining commodity prices and a slowing global economy was one of the main reasons why the 10-year yield diverged from its 2-year counterpart back then. That said, notice that the two essentially topped out at the same time in January 2019, before heading lower. From this, we can conclude that:
-
Short-term yields are extremely sensitive to interest rate changes/expectations of interest rate changes. They tend to rise ahead of actual rate hikes by the central banks, and vice versa
-
Long-term yields are very sensitive to long-term inflation expectations as well. At times when long-term inflation is expected to rise, so would yields of longer-term bonds in order to compensate for higher inflation in the future, and vice versa
-
Short-term interest rates in an economy are influenced by the central bank of that economy
-
Long-term interest rates in an economy are influenced by demand for and the supply of long-term bonds. The higher the demand, the lower the yield tends to be, and vice versa.
As a result, always get into the habit of looking at both, short-term yields, which tell a lot about interest rate expectations, and long-term yields, which tell a lot about long-term inflation expectations.
Correlation between commodities and bond yields
So far, we have discussed the following key concepts as far as commodities are concerned:
-
If steadily rising commodity pricesfuel inflation, interest rates tend to rise
-
If steadily declining commodity prices fuel very low inflation or deflation, interest rates tend to drop
Besides, we have discussed the following key concepts as far as bond yields are concerned:
-
If markets anticipate interest rates to rise in future, bond yields will start rising (with short-term being more sensitive than long-term)
-
If markets anticipate interest rates to fall in future, bond yields will start falling (with short-term being more sensitive than long-term)
From the above, we can conclude the following correlation exists between commodities and bond yields, in general:
-
If steadily rising commodity prices fuel inflationary pressures, bond yields tend to rise
-
If steadily falling commodity prices fuel dis-inflationary/deflationary pressures, bond yields tend to drop
Inflation is an important component in the commodity and bond yield correlation. For instance, if rise in commodity prices are fuelling inflationary pressures in an economy, bond yields will tend to rise. However, if risein commodity prices are not fuelling inflationary pressures, bonds yields are unlikely to rise much.In this section, we shall talk about the correlation between yields and commodities. Keep in mind that not all commodities share the same correlation with yields. While several move in tandem with yields, a few tend to move in the opposite direction. Hence, it is also important to look at the correlation between an individual commodity and yields, rather than just looking at the correlation between an overall commodity index and yields. Let usnow talk about the correlation between:
-
Copper and yields
-
Gold and yields
-
Crude oil and yields
Correlation between Copper and Yields
Copper is often considered a leading indicator of global economic health, given its widespread usage across industries as well as in the construction and the home building sector. Strengthening economic conditions cause industrial and construction activity to pick up, which boosts demand for copper and subsequently lifts its price. Usually, strengthening economic conditions also coincide with rising bond yields, because as economic conditions strengthen, inflation starts to pick up, which reduces demand for traditional bonds. Similarly, weakening economic conditions cause industrial and construction activity to slowdown, which reduces demand for copper and subsequently drags down its price. Usually, weakening economic conditions also coincide with falling bond yields, because as economic conditions deteriorate, inflation starts to decelerate, which increases demand for traditional bonds.
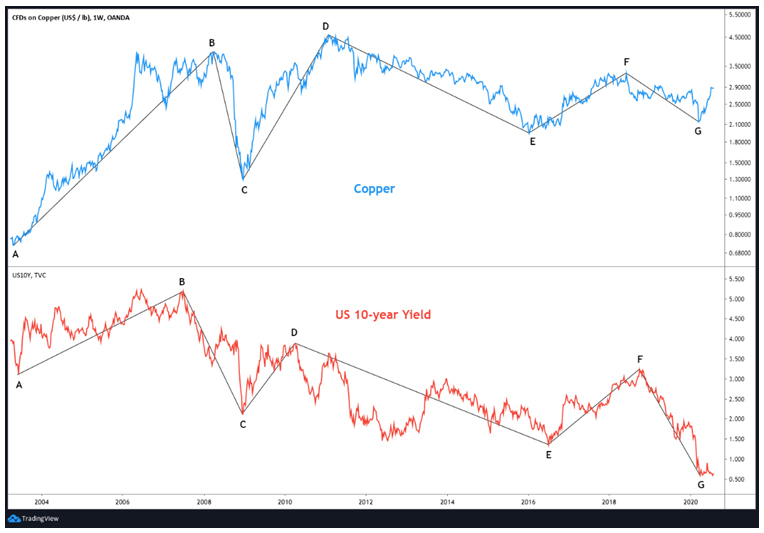
The above chart shows the correlation between US copper prices and US 10-year treasury yield since 2004. Notice that the two usually tend to move in sync. It can be seen above that the multi-year rally in copper prices until March 2008 (A to B) coincided with a steady rise in bond yields. Post this, for the next few months (B to C), both copper prices and yields plunged due to the global financial crisis. Since bottoming out in December 2008, copper recouped its entire 2008 decline until January 2011 (C to D). During this period, bond yields also rose sharply. Meanwhile, in the next few years from January 2011 till January 2016 (D to E), copper prices steadily declined, primarily weighed by a cooling Chinese economy, which reduced the demand for copper. This decline in copper prices also coincided with falling bond yields, as long-term inflationary pressures receded. Following this, from January 2016, copper prices strengthened over the next two-and-half years (E to F), as the steady slowdown in Chinese growth started moderating and as the US presidential election in 2016 boosted thereflation trade. This rebound in copper prices caused yields to recover during the same period. After topping out in June 2018, copper prices declined until March 2020 (F to G), weighed by the resumption of a slowing Chinese economy, trade war between the US and China, and the onset of the Covid-19 pandemic. This decline in copper prices coincided with US yields plunging to record lows as long-term inflationary pressured ebbed and deflationary, recessionary fears grew. Since March 2020, copper prices have rebounded strongly, but yields have failed to rebound, as the unprecedented policy measures of the Federal Reserve have kept yields suppressed near their life-time lows.
From the above chart, we can see that:
-
There is a strong positive correlation between copper and yields
-
Strengthening copper prices exert upward pressure on yields, and vice versa
-
China has a strong impact on the trajectory of copper prices and subsequently on US yields
- Copper acts as a leading indicator of global economic health because of its widespread usage
Correlation between Gold and Yields
Gold is often considered a hedge against inflation, tending to perform well when inflationary pressures are rising and when the rise in nominal yields is not able to keep up the pace with the rise in inflation. Gold also performs well during times of rising tail risks and heightened volatility in the financial markets. Apart from equities, fixed income instruments, cash, and real estate, gold also forms an important part of an investor’s portfolio that is used to diversify risks. Here is an important concept to remember about gold. Gold is a non-interest-bearing asset. In other words, gold does not generate periodic cash flows like stocks (dividends),bonds (coupons), and real estate (rent)do. Instead, gold generates returns by way of capital appreciation only. As such, gold, a non-interest-bearing asset, always tends to compete with interest-bearing assets, such as stocks, bonds, and real estate. It is because of this that gold usually tends to move in the opposite direction of bond yields. When sovereign bond yields rise, the attractiveness of gold reduces, and vice versa.
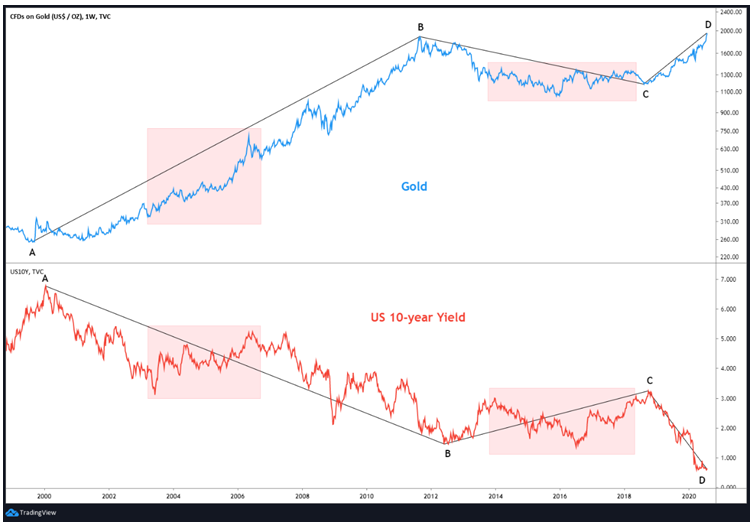
The above chart shows the correlation between gold price and US 10-year yield since 1999. It can be seen that gold made a major bottom in September 1999 and entered into a very powerful uptrend that lasted until August 2011 (A to B). This bull market in gold coincided with a major decline in US yields. After topping out in August 2011, gold steadily declined till November 2015, before consolidating (albeit with forming higher lows) until mid-2018 (B to C). During this period, the US yields were quite volatile. But by mid-2018, they had managed to more than double from the mid-2012 lows. Finally, observe that the top in yields in September 2018 and their subsequent sharp fall since then (C to D) coincided with gold entering into a major uptrend during this period. In fact, the plunge in US yields to record lows has coincided with gold prices recently surging to record highs. Meanwhile, the shaded regions represent periods when the inverse correlation between gold and yields broke. See that during this period, the two moved in tandem. Occasionally, in the short-to-medium-term, the correlation between the two can break down because of outside market forces, before resuming again.
Meanwhile, the above chart shows the correlation between gold price (RHS, red line) and US 10-year TIPS yield (LHS, blue line). Notice how a major peak in one coincides with a major trough in the other, and vice versa. Gold tends to thrive when real yields (nominal yields adjusted for inflation) turn negative. This is because when real yields turn negative, bonds are effectively not generating any periodic returns, when adjusted for inflation. This magnifies the demand for gold. On the other hand, when real yields are positive and are rising, demand for gold tends to reduce as bonds start becoming more attractive due to the periodic cash flows that they generate.
From the above discussion, we can conclude that:
-
Gold tends to perform well when rise in nominal yields fail to keep pace with rise in inflation
-
Gold also performs well during periods of risk aversion and heightened volatility
-
There is a negative correlation between gold price and bond yields
-
Risingbond yieldsexert downward pressure on gold, and vice versa
-
Gold and real yields share a strong negative correlation
-
Gold thrives during periods when real yields and falling and near zero, and vice versa
Correlation between Crude oil and Yields
Crude oil is a very crucial commodity, given the wide-ranging impact it has on the lives of everyone. Given its massive usage in the industrial sector as well as in transportation sector, crude oil directly as well as indirectly affects inflationary trends. The direct impact of crude oil on inflation is that it affects fuel price, which in turn affects the disposable income of people (the higher the fuel prices goes, all else equal, people will spend a higher portion of their income on fuel, which in turn will reduce their disposable income, and vice versa). Meanwhile, the indirect impact of crude oil on inflation is that affects the cost of transporting goods and products while also raising manufacturing costs, which in turn affects the selling price of such goods and products (think about fruits and vegetables, for instance. A surge in transportation costs will increase the price of these commodities, and vice versa). While rising oil prices could suggest that global economic conditions are strengthening, too high a price can pose problems and lead to surge in price pressures. On the other hand, while falling oil prices are beneficial to consumers,too low a price can raise worries over the health of the global economy. Hence, stability in oil price is usually preferred by most nations around the world.
The above chart shows the correlation between crude oil price and US 10-year yield since 2000. See that oil prices surged nearly five-folds from late-2001 to mid-2006 (A to B). As the oil price rally gathered momentum, yields bottomed out in mid-2003 and steadily climbed over the next three years. Meanwhile, notice the first shaded region. During this period, oil prices tripled. Despite this, yields softened. The major reason for the softening of yields was the Fed starting to cut interest rates from September 2007 amid rising turmoil in the US housing sector. Similarly, notice the second shaded region. During this period too, oil prices rose but yields fell. The fall in yields was again because of the unprecedented accommodative measures the Fed took to prevent the US economy from collapsing. As a result of such Fed-induced interventions, between 2007 and 2013, whenever oil prices rose, it did not cause yields to move higher. Since 2013 however, the traditional positive correlation between oil prices and yields has resumed. Notice that the plunge in oil price from mid-2013 to mid-2016 coincided with a fall in yields (C to D). Meanwhile, the recovery in oil price from mid-2016 to late-2018 coincided with a rise in yields (D to E). Again, the slump in oil price from late-2018 to March 2020 coincided with a drop in yields to record lows (E to F). Since March 2020 however, the two have again diverged. While oil prices have recovered, yields are still suppressed. Again, this divergence is because of the unprecedented actions the Fedhas taken to prevent Covid-19 lockdown from hampering the US economy. Due to the Fed’s actions, yields have continued hovering near record lows.
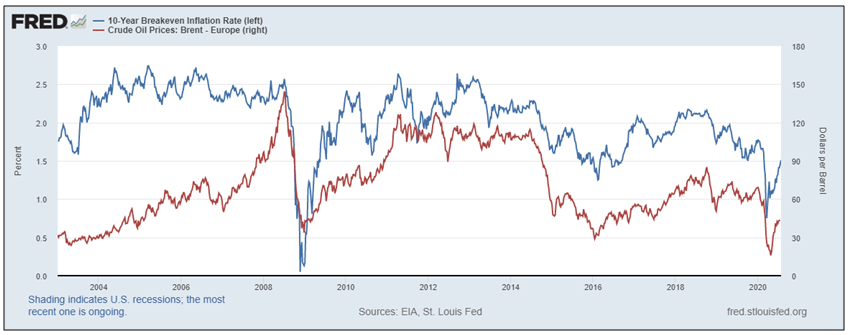
The above chart shows the correlation between Brent crude (RHS, red line) and US 10-year breakeven inflation rate (LHS, blue line) since 2004. The 10-year breakeven inflation rate measures the expected inflation and is calculated as the 10-year nominal yield minus the 10-year TIPS yield. Notice above how strongly long-term inflation expectations are influenced by the price trajectory of crude oil. It can be seen that when oil prices rise, so do inflation expectations, and vice versa.
From the above discussion, we can conclude that:
-
Oil prices strongly influence the trajectory of inflation, both directly and indirectly
-
There is a positive correlation between oil price and bond yields
-
Rising oil price causes bond yields to rise, and vice versa
-
There is a positive correlation between oil price and breakeven inflation rates
-
Rising oil price causes breakeven inflation rates to rise, and vice versa
-
Sometimes, because of the actions of the Fed, the positive correlation between oil and yields could break
Next Chapter
Comments & Discussions in
FYERS Community

