
So far, we have discussed three of the four most critical intermarket relationships. These are the relationships between:
- Currencies and Commodities
- Commodities and Bonds
- Bonds and Stocks
In this chapter, we shall study the fourth most critical intermarket relationship, which isthe one between Commodities and Stocks. When comparing the correlation between the two, we shall talk about commodities, both from a collective perspective (CRB index) as well as from an individual perspective (Gold).
Commodities and stocks tend to move in tandem
Generally, commodities and stocks move in sync.In an economy that is expanding, demand for goods and services will be on the rise. This increase in demand for goods and services from consumers will increase the demand for raw materials, such as commodities, that are needed to make such products. So, as the demand for goods and services goes up, so does the demand for commodities. Hence, when economic conditions are strengthening, commodities and stocks tend to rise in tandem. However, once the inflationary impact of rising commodity prices becomes a threat and prompts central banks to adopt tight monetary policies, commodities and stocks tend to decouple. This is because as interest rates start going up, the cost of borrowing also increases while the quantum of money supply in the economy decreases. This starts dampening the demand for a company’s goods and services, causing stock prices to start declining. Eventually, as the demand for goods and services reduces, so does the demand for raw materials, which cause commodities to top out and start following stocks lower.
Similarly, in an economy that is contracting, demand for goods and services will reduce. This reduced demand for goods and services will reduce the demand for commodities too. Hence, when economic conditions are deteriorating, commodities and stocks tend to fall in tandem. To combat the threat of recession and/or deflation, central banks start adoptingaccommodative monetary policies, causing commodities and stocks to start decoupling. The increased money supply eventually starts to revive the demand for a company’s goods and services, causing stock prices to start bottoming out and recover from their troughs. Eventually, as the demand for goods and services revives, so does the demand for raw materials, which causes commodities to bottom out and start following stocks higher.
This typical behaviour is identical with what we said in the previous chapter. Recollect from the business cycle image that by the time the economy enters the late-expansionary stage, stocks would typically have topped out and started declining, while commodities would still be in an uptrend but nearing the end of it. During this period between the economy topping out and entering the late-expansionary phase, it is typical for stocks and commodities to diverge beforecommodities join stocks lower as the economic growth continues decelerating. The same logic also applies, but of course in reverse order by the time the economy enters the late-contractionary stage. By then, stocks would typically have bottomed out and started rising, while commodities would still be in a downtrend but nearing the end of that downtrend. During this period between the economy bottoming out and entering the late-contractionary phase, it is typical for stocks and commodities to diverge before commodities join stocks higher as the economy continues reviving.
From this, it can be gleaned that:
-
Stocks and commodities move in sync most of the times
-
In a reviving/strengthening economy (i.e. between the late-contractionary stage till the time the economy peaks out), stocks and commodities tend to rise most of the time (with intermittent corrections in between)
-
In a weakening/contracting economy (i.e. between the late-expansionary stage till the time the economy bottoms out), stocks and commodities tend to fall most of the time (with intermittent recoveries in between)
-
Between the time the economy peaks out and enters the late-expansionary stage, stocks and commodities tend to decouple, with stocks starting to declinewhile commodities continue to rally, before eventually topping out and joining stocks lower
-
Between the time the economy bottoms out and enters the late-contractionary stage, stocks and commodities tend to decouple, with stocks starting to rally while commodities continueto fall, before eventually bottoming out and joining stocks higher
The traditional correlation held well between 1994 and 2011
The chart below compares the price action between the Thomson Reuters CRB Index and the Dow Jones Industrial Average (DJIA) index between mid-1994 and late-2011.
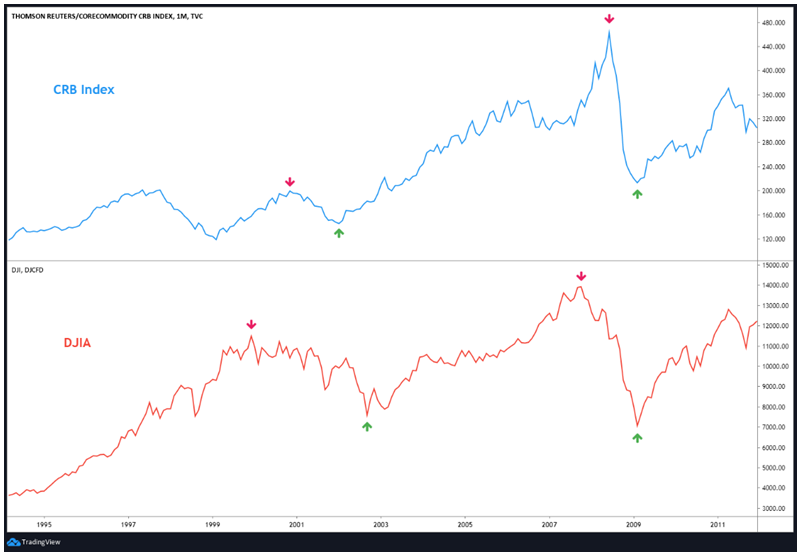
Broadly speaking, it can be seen that between this period, the traditional positive correlation between commodities and stocks held up pretty well. That is, both the asset classes moved pretty much in tandem during this period, both during advances as well as during declines. Notice the arrows in the CRB Index and the corresponding arrows in the DJIA index.
See that the DJIA index made a major top in December 1999, while the CRB index topped out almost a year later in November 2000. Between December 1999 and November 2000, the two decoupled as stocks fell while commodities rose. This adheres to what we said earlier that stocks tend to top out and start declining before commodities top out and start declining. What is however interesting to note is that the CRB index bottomed out in January 2002while the DJIA index followed suit later in September 2002. One of the reasons why commodities bottomed out ahead of stocks was the action taking place in the currency market. The bottom in the CRB index in January 2002 coincided with a major top in the DXY index in January 2002 as well. As the dollar started its precipitous fall, commodities received a major boost, causing them to bottom out before stocks and start rallying.
Meanwhile, after bottoming out in September 2002, the DJIA joined the up move in the CRB index and both the indices entered a powerful uptrend over the next 5-6 years. The DJIA index eventually topped out in October 2007 and started declining, while the CRB index topped out nearly 9 months later in June 2008. Between October 2007 and June 2008, stocks fell while commodities entered a parabolic rally before eventually topping out. From June 2008 to February 2009, both stocks and commodities came under immense selling pressure because of a recession and the global financial turmoil. Both the CRB index and the DJIA index bottomed out simultaneously in February 2009, boosted by massive amounts of liquidity and economic stimulus poured in by central banks around the world to curtail the financial crisis. Over the next couple of years from February 2009, both commodities and stocks again rallied in tandem.
This 16-year period between 1994 and 2011 was characterized by commodities and stocks moving pretty much in tandem with each other, both during rallies as well as during declines. However, post 2011 the traditional positive correlation between the two decoupled.
This traditional correlation then decoupled between 2011 to 2019
As we saw above, the first decade of the 21st century was characterized by commodities and stocks moving in tandem. However, the second decade of the 21st century was characterized by the traditional positive correlation between commodities and stocks decoupling. Again, the chart below compares the price action between the CRB Index and the DJIA index between 2008 till date.
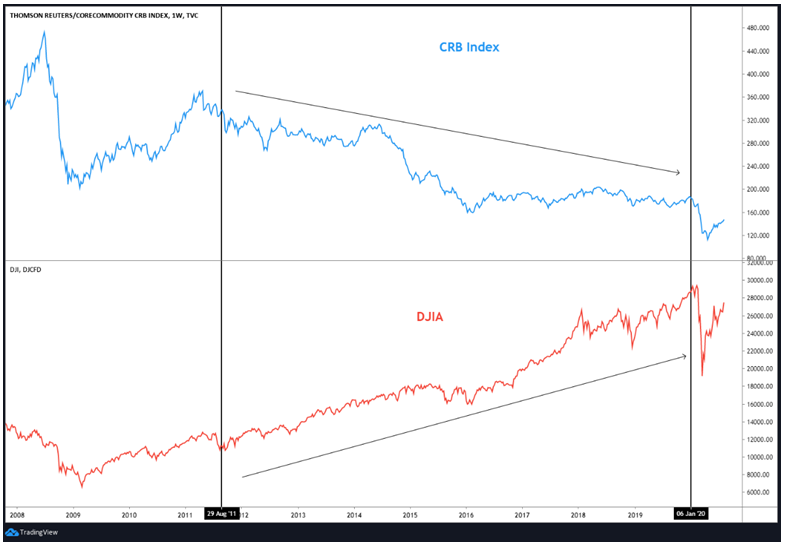
Notice the region within the two horizontal lines. This reflects the period between 2011 and 2019. See that during this period, the CRB index fell until January 2016 before consolidating over the next four years, whereas the DJIA index steadily headed higher. In fact, during this entire period, the CRB index nearly halved in value, while the DJIA index nearly tripled in value.
Commodities weaken due to Dollar strength, China slowdown
The two major factors that contributed to the bull market in commodities between 2002 and 2008 were dollar weakness and economic boom in China. These factors combined bolstered the demand for commodities, in turn causing them to soar during this period. This role, however,reversed between 2011 and 2019. During this period, the dollar strengthened while China entered a prolonged period of economic weakness. These factors reduced the demand for commodities, in turn causing them to weaken.
.PNG)
The chart above shows the annualized YoY percent change in China’s GDP. See how the growth rate of the world’s largest commodity consumer accelerated from 2000 to 2008, before gradually decelerating, especially since 2011. This has had a notable impact on commodities prices. Being the second largest economy in the world as well as the largest commodity consumer, it makes sense to keep a periodic track of China’s health as this tends to strongly influence trends in commodities.
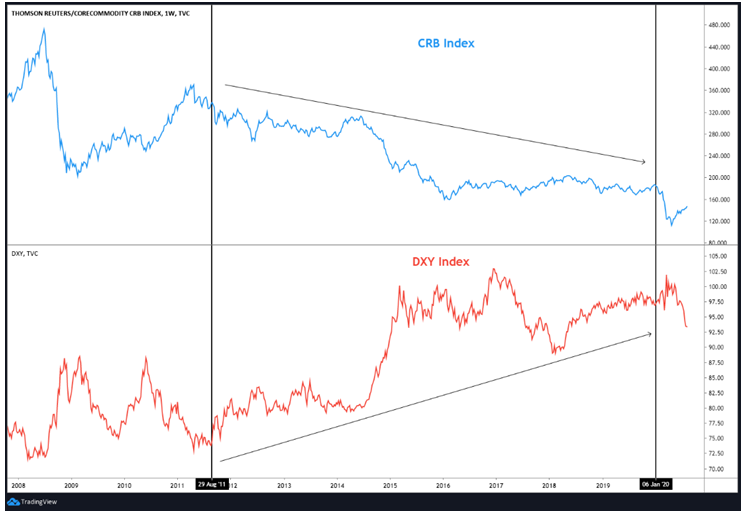
Meanwhile, the chart above compares the CRB index with the DXY index. See that the decline in commodities between 2011 and 2019 more or less coincided with a rising dollar during this 8 year period.
Stocks strengthen due to ultra-low interest rates, liquidity infusion
On the other hand, stocks decoupled from commodities between 2011 and 2019 and instead rallied on the back of near-zero interest rates not only in the US but across several other major developed economies as well. The near-zero interest rates coupled with abundance of liquidity infused by global central banks during and after the 2008 turmoil played a key role in driving stock prices higher.
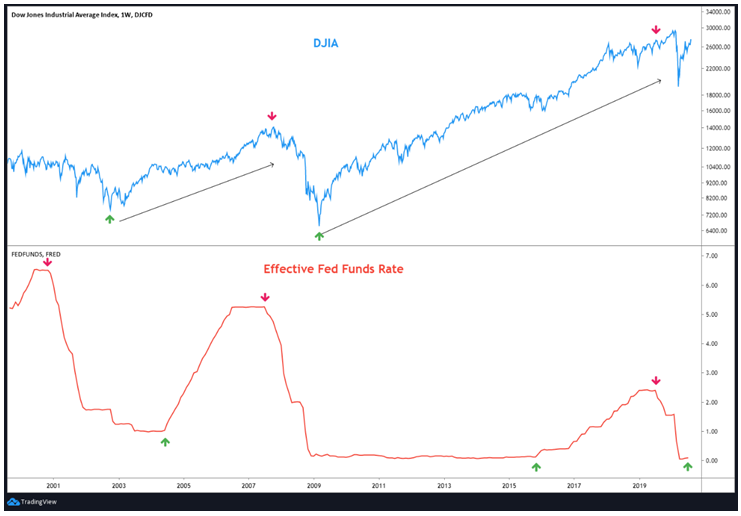
See in the above chart that the decline in Fed Funds rate from 6.50% in late-2000 to 1.00% by mid-2004 played an important role in ending the bear market and ushering a new 5-year bull marketin US stocks. Similarly, the Fed Funds rates declined from 5.25% in mid-2007 to 0% by early-2009 and then stayed there until late-2015. Also, the Fed printed billions of dollars and infused it into the economy between 2008 and 2012. Such unprecedented measures by the US central bank bolstered liquidity into the economy, which eventually found its way into equities in search for higher returns. This has been a major driver behind the stock market advance from the March 2009 bottom. Just to say, the DJIA index nearly quadrupled in value from March 2009 till end-2019.Because of these contrasting forces, commodities and stocks decoupled for most parts of the last decade, wherein the former steadily headed lower and the latter steadily headed higher.
Since the start of 2020, the traditional correlation seems to have resumed
As stated earlier, the first decade of the 21st century was characterized by commodities and stocks moving in tandem. Then, the second decade of the 21st century was characterized by the traditional positive correlation between commodities and stocks decoupling. Now, since the start of the third decade of the 21st century (that is since the start of 2020), the traditional correlation between commodities and stocks seems to have resumed. Notice the usage of the word ‘seems’ here. The reason for saying so is because we are talking about long-term correlations, ones that have lasted for 10 years or more. As such, it is still premature to say the traditional correlation between the twohas resumed because of two things. One is that this correlation has been in place for just under six months. There is a need to see whether this positive correlationholds over a slightly larger time frame, say over one to two years. Second is that the resumption of the traditional correlation between the two has occurred in the midst of a major global pandemic and the subsequent unprecedented measures announced by central banks around the world to revive the global economy from a deep recession. It is common for commodities and stocks to move in tandem during and after an economic crisis. Hence, one must monitor whether the currentpositive correlation between the two holdsas and when things start normalizing going forward.

The chart above compares the price action of the CRB Index with the DJIA index over the last few months. It can be seen that commodities peaked out and started declining from early-2020. Stocks followed suit more than a month later and joined commodities in moving lower. From mid-February, both commodities and stocks fell sharply. Stocks bottomed out in late-March, while commodities bottomed out a month later. Since late-April, the two have risen in tandem. So, as we can see from the chart, the positive correlation between commodities and stocks has prevailed since mid-February.
From the above, we can conclude that:
-
Dollar has a strong bearing on the long-term and short-term trajectory of commodities
-
Low interest rates and liquidity have a strong positive influence on the trajectory of stocks
-
From 1994 to 2011, the traditional correlation between commodities and stocks held strongly
-
Between 2011 and 2019, commodities and stocks moved in the opposite direction, with commodities falling due to strengthening dollar & weakening Chinese economy and equities rising due to ultra-low interest rates
-
Since early-2020, the traditional correlation between commodities and stocks seems to have resumed
-
However, it is still premature to say whether this traditional correlation has returned from a long-term perspective
-
For a year or two, one needs to monitor this correlation to see whether it remains positive, especially once the current turmoil ends and things start normalizing
Gold as an asset class vs.equities
Gold often forms an important component of an investor’s portfolio. Usually, it is allocated in a certain proportion in one’s portfolio. This proportion varies, depending on various factors, the key amongst which is an investor’s perception about future economic conditions. For instance, during times when an investor is optimistic about future economic conditions, he/she tends to allocate a greater proportion to riskier assets, such as equities. On the other hand, during times when an investor is pessimistic about future economic conditions, he/she tends to increase allocation to gold. There are various reasons why gold, rather than any other commodity, forms an important component of one’s portfolio. To name a few:
-
Gold is an extremely liquid asset
-
Gold is a scarce asset
-
Gold tends to perform well during both inflationary and deflationary environment
-
Gold tends to perform well during times of heightened volatility and financial turmoil
-
Gold, being a hard asset, is not subject to default or credit risk
-
Gold benefits from currency devaluations
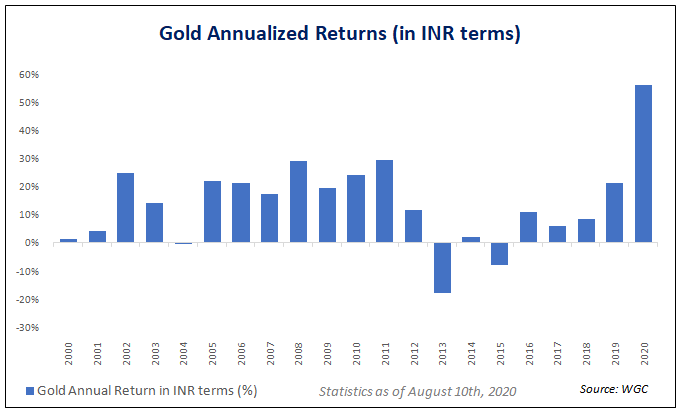
The chart above shows the annualized percent return gold has generated in INR terms since the year 2000. It can be seen that out of 21 years, gold has generated positive returns on 18 occasions, with an average annual return of 14% during this period. Taking about gold in USD terms, in the last 21 years, the yellow metal has generated positive returns on 17 occasions, with an average annual return of 11% during this period. Meanwhile, let us now compare this to equities. Since 2000, SENSEX has generated positive returns on 15 occasions, with an average annual return of 15% during this period. Talking about the US markets, the DJIA has generated positive returns on 13 occasions, with an average annual return of 5% during this period. Let us highlight this in table below:
| Number of timesGoldhas appreciated annually since 2000 (in Years) | Average Annual Return since 2000 (in %) | |
| Gold (in $ terms) | 17 | 11.0% |
| DJIA | 13 | 5.4% |
| Gold (in ₹ terms) | 18 | 14.1% |
| SENSEX | 15 | 14.8% |
From the above table, it can be seen that gold in INR terms has performed nearly as good as Indian markets, in general, have over the last 2 decades. In USD terms, on the other hand, gold has outperformed the US markets, in general, during this period.
The correlation between Gold and Stocks
Long-term correlation (Secular trend)
Gold and stocks share a rather dynamic correlation. Typically,if talked about from a longer-term perspective, it can be said that the yellow metal and equities move counter to each other. That is, gold tends to rally during periods when stocks, in general, are declining or are undergoing a prolonged period of negligible returns. Similarly, gold tends to decline during periods when stocks, in general, are in a powerful uptrend. To understand this better, let us compare the price action of gold and the DJIA over the past four decades.
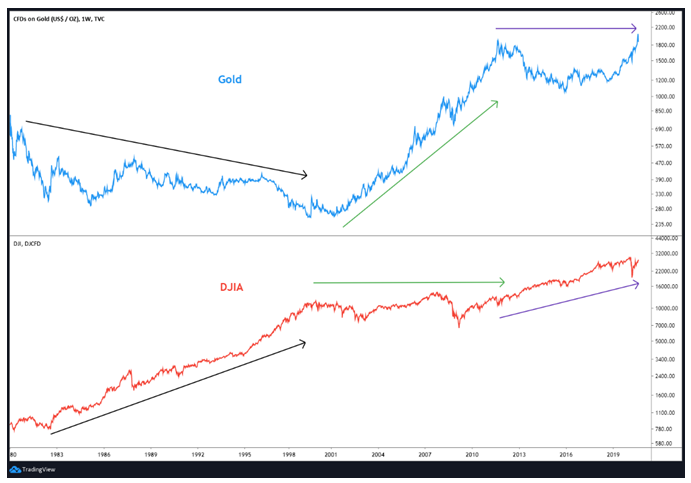
In the above chart, each arrow in gold and the corresponding arrow in the DJIA index represents the secular trend (i.e. the long-term trend). We have split these 40 years into three periods as follows:
The first is from early-1980 to late-1999, represented using the black arrows. Notice that during these two decades, the DJIA index was in a very powerful bull market, gaining nearly 15 times in value. On the other hand, see that gold was in a steady downtrend during these two decades, losing nearly two-thirds of its value. Observe that the top in the DJIA index more or less coincided with the bottom in gold towards the end of 1999.
The second is from early-2000 to mid-2011, represented using the green arrows. Notice that by the end of this period, the DJIA index was essentially where it was towards the start of this period. In other words, stocks, in general, languished during this onedecade period. On the other hand, observe that during this same period, gold entered a major bull market, gaining almost 8 times in value.
The third is from late-2011 to present, represented using the purple arrows. During this one decade, it can be seen that the DJIA was in a steady and powerful uptrend, during which it nearly tripled in value. Over the same period, see that, as of today, gold is essentially where it was towards the start of this period. In other words, gold has languished during the past decade.
Medium-term correlation (Primary trend)
While in the long-term (10 years or more), gold and stocks usually move counter to each other, in the medium-term (4-5 years), the correlation is not so straight forward. Sometimes, the two move in the opposite direction, while on other occasions they move in the same direction. To understand this better, let us compare the two between 2003 and 2011 and then again between 2011 and 2020. The chart below compares the price action of the DJIA index and gold between 2003 and 2011:

Notice above that between March2003 and October2007, both gold and the DJIA rallied. Later between March2008 and November2008, the two fell. Then again, between March2009 and August2011, the two moved higher. In the long-term chart shown earlier, we saw that between early-2000 and mid-2011, gold was in a powerful uptrend, while the DJIA index was essentially unchanged. However, when dissected from a medium-term perspective, three primary trends are clearly visible in the DJIA index within the context of the larger secular trend– first up (2003-07), then down (2008), and then up again (2009-11). And during this period, as said above, even gold moved in tandem with the stock markets.
Why does this happen? The reason why this happens is because in the medium-to-short term, there would be coinciding forces as well as individual market forces that will cause both stocks and gold to move in tandem. For instance, between 2003 to 2007, stocks and gold both rallied because of individual market forces. Stocks were underpinned by a strengthening global economy, whereas gold was underpinned by the dollar’s weakness, the Central Bank Gold Agreement (CBGA, 1999) which put a cap on official sector gold-selling, and strong physical buying from India, China. On the other hand, between 2009 and 2011, stocks and gold both rallied because of positive coinciding forces. Both these asset classes were supported by zero interest rates across the developed world and massive amounts of liquidity being pumped by central banks around the world, primarily the Fed, to revive the global economy from the 2007-08 GFC.
Meanwhile, the chart below compares the price action of the DJIA index and gold between 2011 and 2020:
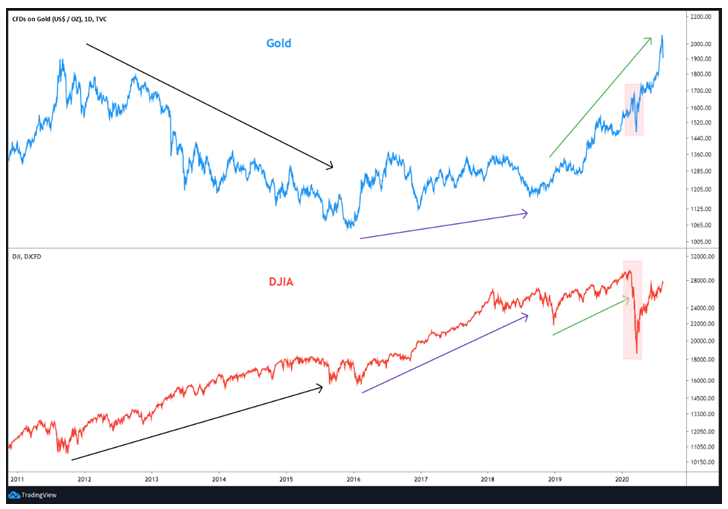
Notice above that between September2011 and November 2015, the DJIA index rallied sharply while gold fell sharply. The opposing movement during this period was because of individual market forces. Supporting the rally in stock markets were accommodative monetary policies around the world as well as a rebounding global economy and corporate earnings. On the other hand, adding to pressure on gold were a strong recovery in the DXY during this period, an improving risk appetite, and rising real rates.
Meanwhile, November 2015 to August 2018 was a period when gold started forming a base by gradually forming higher highs and lows, partly supported by a peak in the DXY during this period. Notice that stocks rallied sharply during this 3-year period, with the DJIA index surging to historic highs.
Finally, since December 2018, notice that both the DJIA index and gold have rallied in tandem, boosted by positive coinciding forces. During this period, both stocks and gold were supported by US interest rates topping out and starting to head lower. In fact, with the US interest rates dropping to zero and with the Fed taking unprecedented policy measures since March 2020 to revive economic conditions in the US, both stocks and gold have rallied in tandem.
From the above, we can conclude that:
-
From a secular-trend (long-term) perspective, stocks and gold tend to move in the opposite direction. Periods when stocks are in a sustained uptrend are usually accompanied by lack of interest in gold, and vice versa
-
From a medium-term (primary trend) to short-term (intermediate trend) perspective, the correlation between stocks and gold is not so straight forward. Sometimes, the two move in the opposite direction, while on other occasions they move in the same direction
-
Because of the variable nature of the correlation between stocks and gold from a medium-to-short-term perspective, one needs to closely monitor the price trends of the two asset classes periodically to gauge whether they are moving in tandem or counter to each other
-
Generally speaking, during periods of risk appetite, stocks rally and gold declines, whereas during periods of risk aversion, stocks fall and gold rallies.
Next Chapter
Comments & Discussions in
FYERS Community