
 12 Jun, 2023
 5 mins read

You might have heard of the saying, 'Knowledge is Power.'
It's a famous proverb highlighting that knowledge is a weapon that can help you conquer the world. And interestingly, this is of immense importance in the world of stock markets.
The stock markets have been the buzz of late, with more and more people exploring ways to capitalize on opportunities and create fortunes. However, there is a dire need to prevent them from blind investments or haywire stock picking.
But, amidst the constant fluctuations and uncertainties around the markets, how can you make a wise choice and avoid costly mistakes?
Fortunately, there are powerful tools at your rescue!
SWOT and QVT functionality of FYERS App 2. O is a significant development to help you analyze companies quantitatively. SWOT stands for Strengths, Weaknesses, Opportunities, and Threats, and QVT is an acronym for Quality, Valuation, and Technicals.
With the SWOT tool, you can immediately assess a company's strengths, weaknesses, opportunities, and threats and understand its financial health and prospects. At the same time, the QVT metric provides insight into the company's financial performance, pricing, and technical indicators.
In this blog, we will understand the importance of SWOT and QVT in simplifying stock analysis and guiding investment decisions.
SWOT analysis is a structured and refined approach to evaluate a company quantitatively and assess its current position and prospects. Let's understand the critical components of SWOT analysis and how they contribute to stock analysis:
Start with Strengths
The first and foremost step in conducting an effective SWOT analysis of a company is to identify and analyze its strengths. As we all know, strengths make you different from others. Similarly, from a company's standpoint, strengths are internal factors that can give it an edge over the competitors.
Identifying a company's strengths allows investors to gauge its competitive advantages and growth potential. Financial metrics such as revenue, profit margins, growth, return on equity (ROE), and debt-to-equity ratio are analyzed to determine a company's strengths. Strong financials indicate a company's ability to generate consistent profits and manage its debt effectively.
Weigh Weaknesses
As we proceed with the SWOT analysis process, the next step is to identify and analyze weaknesses about a stock. Weaknesses are the internal factors that can put a company in a disadvantageous position compared to its peers.
Assessing a company's weaknesses helps investors understand its potential risks and challenges. Factors like declining revenue, low-profit margins, low ROE, and high debt-to-equity ratio can indicate weaknesses. Understanding a company's weaknesses allows investors to make informed decisions about the risks.
Observe Opportunities
The next step in the process of SWOT analysis is to identify opportunities. Opportunities are favorable external factors that can help a company accelerate its growth and increase profits. Identifying external opportunities can help investors spot favorable market conditions or industry trends that could benefit a company. Factors such as sales and profit growth, business turnaround, rising share price, and low price-to-earnings (PE) ratio can indicate potential opportunities. Capitalizing on these opportunities can contribute to a stock's growth and profitability.
Trace Threats
The final step in conducting a company's SWOT analysis is to trace threats. Threats are external factors that can significantly impede the company's overall growth and profitability. Recognizing external threats allows investors to anticipate risks that may negatively impact a company's performance. Regulatory constraints, technological advancements, and market competition are some common threats. Awareness of threats enables investors to assess the potential impact on a stock's prospects.
SWOT analysis gives Investors a holistic understanding of a company's strengths, weaknesses, opportunities, and threats. This analysis helps them make informed investment decisions by considering internal and external factors.
QVT metrics encompass three key parameters: Quality, Valuation, and Technicals. Each parameter provides a distinct perspective on a stock's performance and potential. Let's explore each of these parameters in detail:
Quality
The Quality score in the QVT analysis evaluates a company's financial performance, stability, and debt management. It considers factors such as stable revenues, profits, cash flows, and low debt. A higher Quality score indicates good and consistent financial performance, which is a favorable characteristic for investors.
Valuation
The Valuation score assesses the competitiveness of a stock's price based on metrics like the price-to-earnings ratio (P/E), price-to-book value (P/BV), and current share price. A higher Valuation score suggests that the stock is attractively priced, indicating a good investment opportunity.
Technicals
The Technical score focuses on a stock's momentum and technical indicators. It compares the stock's price strength and technical performance to the broader market. A higher Technical score suggests strong momentum and positive technical indicators, which may indicate a bullish trend.
A stock with a high QVT score is more promising. Below is the table showing what the score for each element of the QVT score indicates:
|
Metrics |
Good |
Average |
Bad |
|---|---|---|---|
|
Quality |
>55 |
35-55 |
<35 |
|
Valuation |
>50 |
30-50 |
<30 |
|
Technicals |
>60 |
35-60 |
<35 |
By incorporating the QVT metric into the stock analysis, an investor can comprehensively assess a stock's potential and make more informed decisions.
SWOT and QVT is an invaluable tool that offers several advantages:
SWOT analysis simplifies research by providing a structured framework to assess any stock. Categorizing important factors affecting a stock decision into strengths, weaknesses, opportunities, and threats, SWOT helps organize information logically. Similarly, the QVT score condenses complex financial and technical information into a numerical value, saving investors time. You can focus on critical aspects and avoid information overload.
Facilitates Decision-Making
All the components of SWOT highlighted in bullet points enable traders and investors to quickly understand key factors impacting a particular stock. Also, the QVT score eliminates the need for extensive manual analysis and aids in rapidly assessing the overall attractiveness of the stock. A concise overview fosters faster decision-making and saves time and effort.
Enhances informed decision-making
Conducting in-depth research directly to gain insights about a stock can be time-consuming and require substantial time and effort. SWOT and QVT follow a structured approach and capture critical information. Both provide a snapshot of the stocks' potential, enhancing the depth of analysis for informed decision-making.
Available for all stocks
Regardless of the size and market share of the company, SWOT and QVT feature is available for all the stocks trading in the stock market.
Provides Holistic Approach
SWOT Analysis tool encourages a holistic perspective by considering internal and external quantitative factors impacting a company. Also, the QVT score integrates quality, valuation, and technical indicators, offering a comprehensive assessment of a stock's performance from different angles. Both tools help in effective decision-making and allow capitalizing on market opportunities when they arise.
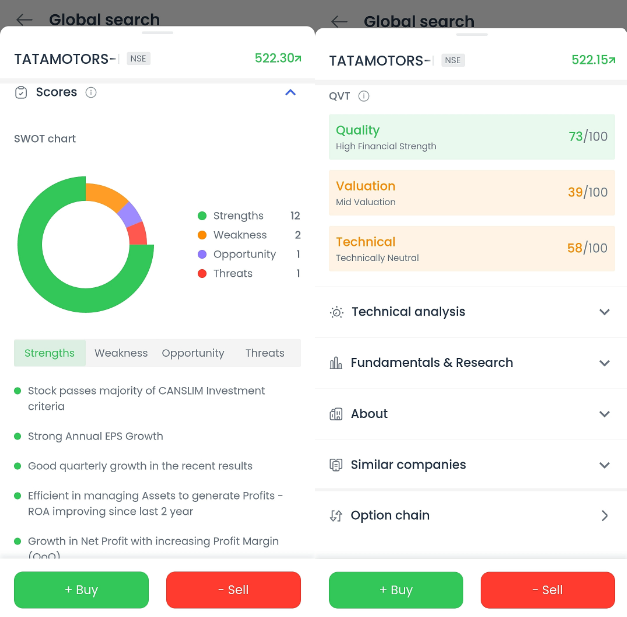
For instance, you want to invest funds in Tata Motors Limited, India's leading multinational automobile manufacturing company headquartered in Mumbai. Before you invest funds, you need to assess the strengths, weaknesses, opportunities, and threats impacting a company and do a quantitative assessment of a stock's quality, valuation, and technical indicators. This important information is crucial, and you can instantly check this from the scores section in App 2.0, as shown below.

As you can see the SWOT chart which clearly provides a snapshot of important information helpful in evaluating the potential of the company. Strengths like strong annual EPS growth is an indication that the company is growing faster and becoming more valuable. Also, you can check weaknesses, opportunities and threats.
Similarly, if you wish to invest in Tata Motors, QVT score as shown above can be useful in making the final decision. The quality score of 73 out of 100 shows that the company is doing great financially. The Valuation score of 39 out of 100, means that the stock is averagely valued. Lastly, a technical score of 58 out of 100 shows a moderate price strength.
All in all, the scores section in App 2.0 provides critical insight before investing money.
SWOT analysis and the QVT framework are invaluable tools for simplifying stock analysis and guiding investment decisions. SWOT analysis enables investors to evaluate a company's strengths, weaknesses, opportunities, and threats, providing a holistic perspective on its financial health and prospects. The QVT framework complements SWOT analysis by quantitatively assessing a stock's quality, valuation, and technical indicators, adding a quantitative dimension to the analysis.
By leveraging these tools, investors can gain a deeper understanding of stocks, identify potential investment opportunities, mitigate risks, and ultimately make more informed decisions. Whether you are a new-age or seasoned investor or a beginner, incorporating SWOT analysis and QVT into your stock analysis process via FYERS App 2.O can significantly enhance your ability to navigate the stock market and achieve your investment goals. But before you explore the new FYERS App 2.O, don't forget to open a Demat account at FYERS. If you are already our customer and find our products and services useful, do consider referring your friends here.
Calculate your Net P&L after deducting all the charges like Tax, Brokerage, etc.
Find your required margin.
Calculate the average price you paid for a stock and determine your total cost.
Estimate your investment growth. Calculate potential returns on one-time investments.
Forecast your investment returns. Understand potential growth with regular contributions.