31 Aug, 2025
 3 mins read

Candlestick patterns are widely used in technical analysis to interpret market psychology. Among these, the long-legged doji—also known as an elongated doji candle—is one of the most important signs of indecision. Traders often watch for this candlestick because it can hint at potential reversals or pauses in price momentum.
In this blog, we explore what the pattern means, how it forms, its bullish and bearish implications, and its role in technical analysis.
A long-legged doji is a candlestick where the opening and closing prices are nearly the same, but the candle has very long upper and lower shadows (wicks). This shape reflects strong market indecision—buyers and sellers push the price far in both directions, but neither side ultimately dominates.
Because of its structure, traders also refer to it as a tall-wick doji or doji with extended shadows.
To identify this pattern, look for these key traits:
Opening and closing prices are almost identical.
Very long upper and lower shadows compared to the body.
Typically appears after strong upward or downward moves.
Signals uncertainty and a possible turning point in the market.
This elongated candlestick is visually different from smaller dojis, as its wicks stretch much further.
The long-shadow doji candle is a reflection of market balance. It shows that both bulls and bears attempted to take control but ended the session at a standstill.
Depending on where it appears, the signal may suggest:
Potential reversal (when found at the top or bottom of a trend).
Consolidation or pause (when seen within a sideways market).
However, traders should confirm with other indicators before acting on this single candle.
There are several doji variations, and each carries a slightly different meaning:
Gravestone Doji – has a long upper shadow and signals possible bearish reversal.
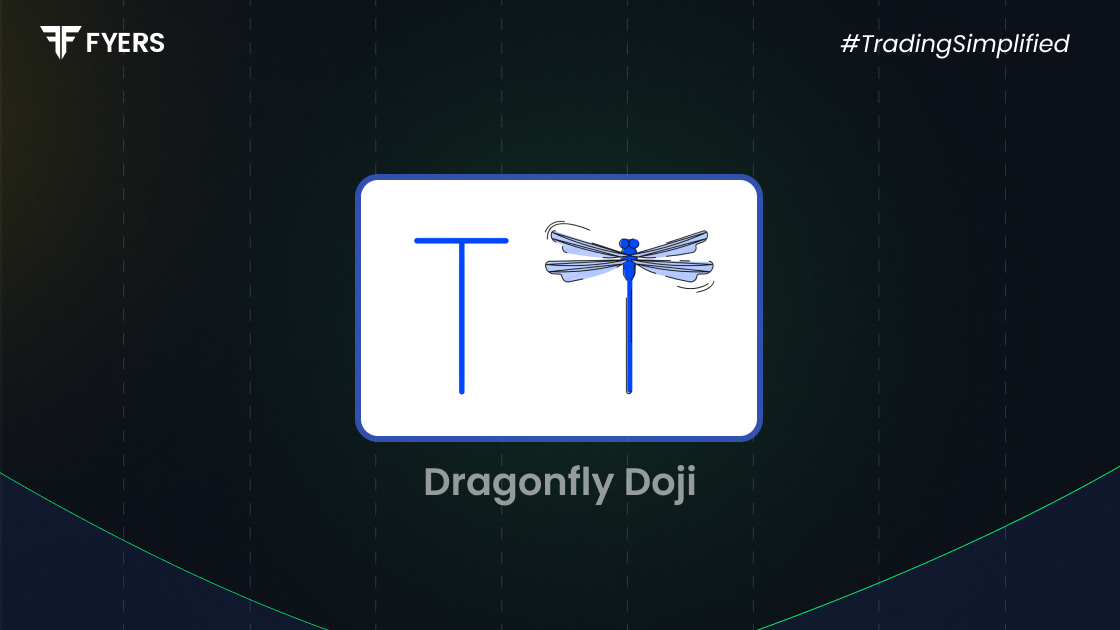
Dragonfly Doji – has a long lower shadow and can suggest bullish reversal.
Standard Doji – very small body with short shadows.
Compared to these, the elongated doji candle stands out for having both shadows extended, emphasising uncertainty more strongly.
Professional traders use the tall-wick doji as a confirmation tool rather than a standalone trading signal. Common strategies include:
Checking trend context—appearing after an uptrend, it may indicate exhaustion.
Pairing with support/resistance zones to confirm reversals.
Using momentum indicators like RSI or MACD to strengthen the signal.
By combining these approaches, traders improve their chances of correctly interpreting the doji.
Bullish case: When the elongated doji forms after a downtrend, it may suggest selling pressure is fading, and buyers are stepping in.
Bearish case: When the same candle forms after a strong rally, it may point to exhaustion among buyers and the possibility of a downward reversal.
This explains why the long-legged doji bearish setup is watched closely at market tops, while the bullish version matters at bottoms.
While useful, the extended-shadow doji candlestick has some limitations:
Appears often in choppy markets, creating false signals.
Cannot predict exact direction without confirmation.
Works best when combined with volume and trend analysis.
Relying solely on this candle may lead to poor trade decisions.
For example, in the Indian stock market, a long-legged doji candle appeared on Nifty 50 charts during a sharp rally in early 2020. The candle showed strong indecision, and shortly after, the market corrected, confirming the bearish signal.
Such real-world examples highlight why traders use the pattern in context rather than isolation.
The long-legged doji candlestick is a powerful indicator of market indecision, appearing when buyers and sellers battle intensely but fail to establish control. Whether it leads to a bullish or bearish reversal depends on context, confirmation tools, and market trend.
Used wisely, the elongated doji candle can enhance a trader’s technical analysis, but it should never be the sole factor in decision-making.
It is a candlestick with very long upper and lower shadows but nearly identical open and close prices, reflecting indecision.
It can be both. At market bottoms, it may suggest bullish reversal; at tops, it may signal bearish reversal.
They use tools like support/resistance zones, RSI, MACD, and volume analysis for confirmation.
The gravestone doji has only a long upper shadow, while the long-legged doji has both upper and lower shadows extended.
Calculate your Net P&L after deducting all the charges like Tax, Brokerage, etc.
Find your required margin.
Calculate the average price you paid for a stock and determine your total cost.
Estimate your investment growth. Calculate potential returns on one-time investments.
Forecast your investment returns. Understand potential growth with regular contributions.

You have successfully submitted your partnership request form. You will be hearing us soon!