15 Sep, 2025
 4 mins read
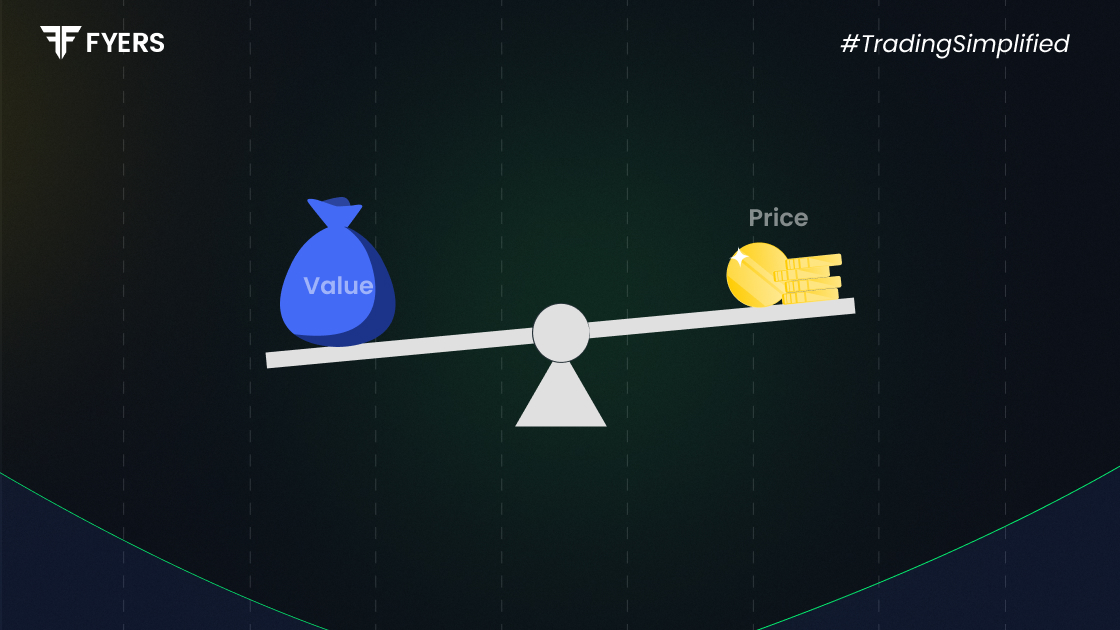
Investors use various tools to evaluate the risk-adjusted returns of an investment. Among them, the Sortino Ratio stands out for its focus on downside risk. Unlike general volatility measures, this ratio looks specifically at negative deviations, making it particularly useful for understanding the quality of returns.
This blog breaks down what the Sortino Ratio means, its components, how it is calculated, how it differs from the Sharpe Ratio, and its limitations.
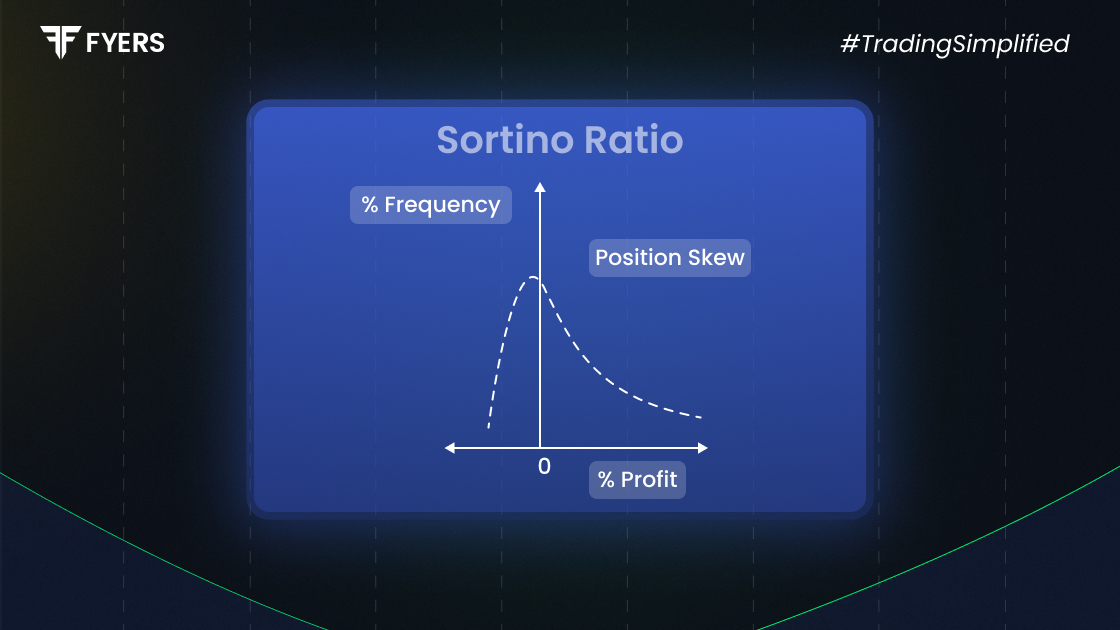
The Sortino Ratio is a financial metric used to assess the risk-adjusted return of an investment, with a particular focus on downside volatility. It helps determine how well an investment compensates investors for the risk of losses, instead of overall volatility.
In simpler terms, it tells you how much return you're earning for every unit of bad risk taken. This makes it a preferred choice among analysts and portfolio managers who believe that only negative volatility should be penalised, as positive volatility is beneficial.
To understand the Sortino Ratio, it's essential to know its core components:
Portfolio Return (Rp): The average return generated by the investment over a given period.
Risk-Free Rate (Rf): The return of a theoretically risk-free asset, like a government bond.
Target Return (Rt): Often equal to or slightly higher than the risk-free rate. It's the minimum acceptable return used to calculate downside risk.
Downside Deviation (Dd): This is the standard deviation of negative asset returns falling below the target return.
The denominator only considers returns that fall short of the target, making the ratio more refined in assessing risk.
The formula for the Sortino Ratio is:
|
Sortino Ratio = (Rp – Rt) / Dd |
Where:
Rp = Portfolio Return
Rt = Target or Minimum Acceptable Return
Dd = Downside Deviation
Identify the target return (Rt).
Calculate the excess return: Subtract the target return from the average portfolio return.
Calculate downside deviation: Measure the standard deviation of returns that fall below the target return.
Apply the formula to get the Sortino Ratio.
A higher Sortino Ratio implies a better risk-adjusted return with lower downside risk.
Though both ratios evaluate risk-adjusted returns, they differ significantly in how they treat risk.
|
Criteria |
Sortino Ratio |
Sharpe Ratio |
|---|---|---|
|
Type of Risk |
Downside deviation only |
Total standard deviation (upside + downside) |
|
Usefulness |
Better for assessing negative risk |
Best for symmetrical return distributions |
|
Interpretation |
Focuses on harmful volatility |
Penalises all volatility equally |
|
Preferred Use Case |
Portfolios with asymmetrical return patterns |
General portfolio performance analysis |
The Sortino Ratio is generally preferred in cases where the return distribution is skewed or when investors are more concerned about downside risk than overall volatility.
Let’s consider a mutual fund with the following details:
Average annual return (Rp) = 12%
Target return (Rt) = 5%
Downside deviation (Dd) = 6%
Using the formula:
Sortino Ratio = (12% – 5%) / 6% = 7% / 6% = 1.17
This means the fund generates 1.17 units of return for every unit of downside risk taken. Generally, a ratio above 1 is considered acceptable, while higher values reflect better performance.
While the Sortino Ratio improves on the Sharpe Ratio in several ways, it is not without its limitations:
Relies on historical data: Past performance may not predict future results accurately.
Assumes a defined target return: The choice of target return can be subjective and affect outcomes.
Ignores upside volatility: While it focuses on downside risk, it overlooks fluctuations that may also affect investor sentiment.
Needs sufficient data points: Calculating downside deviation accurately requires a robust dataset.
Despite these limitations, it remains a valuable tool, especially when used alongside other performance metrics.
The Sortino Ratio provides a more nuanced view of risk-adjusted returns by focusing only on negative deviations from a target return. It is particularly helpful in assessing investment strategies where downside protection is prioritised. While not without its flaws, it serves as a key metric for investors aiming to make informed decisions based on real risk rather than total volatility.
Yes, in general, a higher Sortino Ratio indicates better risk-adjusted performance. It means the investment is generating more return per unit of downside risk. However, it should be evaluated in context with other metrics and investment goals.
A Sortino Ratio above 1 is typically considered good, while ratios above 2 are excellent. These benchmarks, however, depend on market conditions and the category of mutual funds being evaluated.
Yes, a negative Sortino Ratio implies that the portfolio return is below the target return, or that the downside deviation is very high. This reflects poor risk-adjusted performance and suggests that the investment may be failing to deliver acceptable returns.
The time horizon should match the investment goal. For short-term investments, a 1-year ratio may suffice. For long-term analysis, 3 to 5 years of data provides more meaningful insights and captures different market cycles.
Calculate your Net P&L after deducting all the charges like Tax, Brokerage, etc.
Find your required margin.
Calculate the average price you paid for a stock and determine your total cost.
Estimate your investment growth. Calculate potential returns on one-time investments.
Forecast your investment returns. Understand potential growth with regular contributions.

You have successfully submitted your partnership request form. You will be hearing us soon!