19 Sep, 2025
 3 mins read
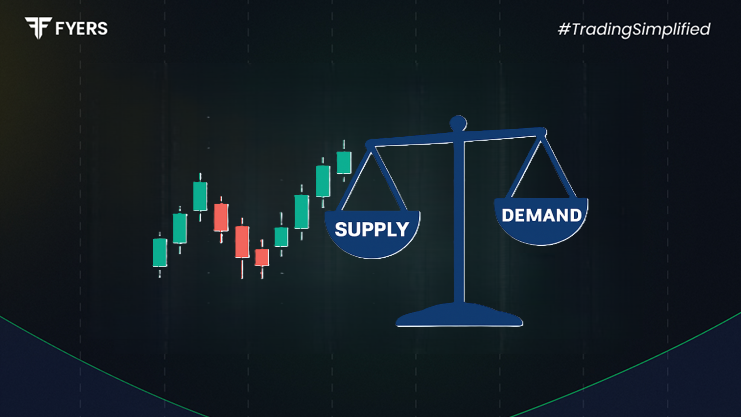
In trading, price movements are largely driven by the forces of supply and demand. When buyers and sellers interact in financial markets, imbalances often create opportunities for traders to anticipate future price moves. This is the foundation of supply and demand trading, a method widely used in equities, forex, and commodities.
This article explains what supply and demand in trading means, how to identify supply and demand zones, common chart patterns, effective strategies, rules to follow, as well as the advantages and limitations of this approach.
Supply and demand in trading refers to how the availability of an asset (supply) and the desire of participants to buy it (demand) affect its price.
Supply: When there are more sellers than buyers, prices tend to fall.
Demand: When buyers outnumber sellers, prices tend to rise.
In the demand and supply in stock market, these shifts often show up as price rallies from demand zones and declines from supply zones. Recognizing these imbalances helps traders predict where price reversals may occur.
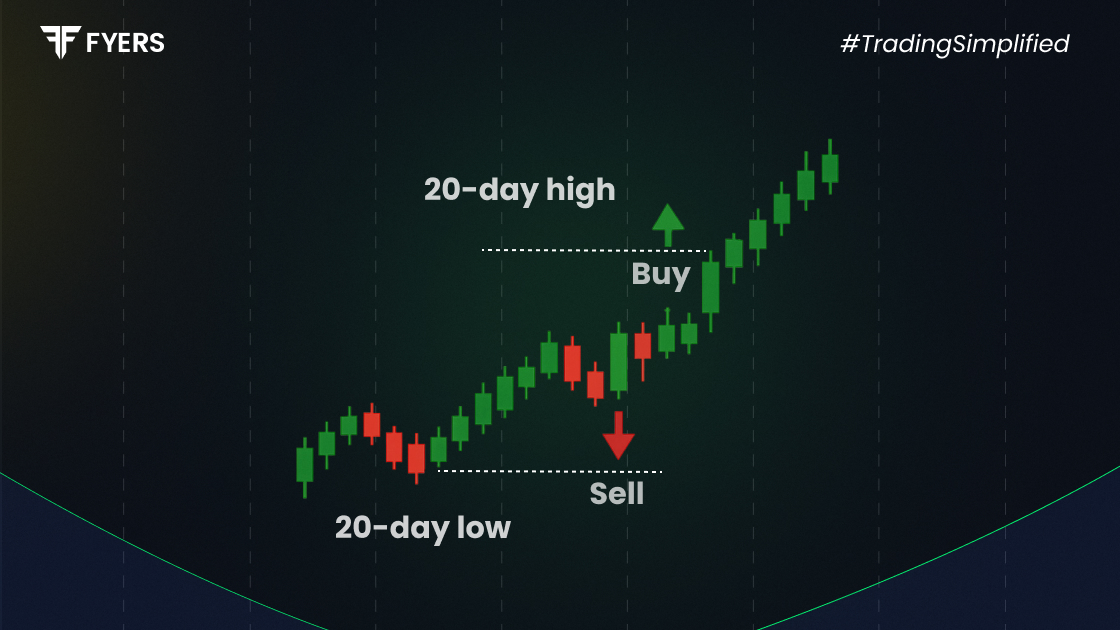
A supply demand zone is an area on the chart where price previously reversed due to strong buying or selling activity.
Demand Zone: A price area where buyers aggressively entered, pushing the price higher.
Supply Zone: A price area where sellers dominated, forcing the price lower.
These zones are crucial in supply and demand trading because they act as support and resistance levels. Traders mark them on charts to anticipate possible price reactions.
Certain supply and demand chart patterns reveal how imbalances form and resolve:
Drop-Base-Rally (Demand pattern) – Price drops, consolidates, then rallies upward.
Rally-Base-Drop (Supply pattern) – Price rallies, consolidates, then drops downward.
Rally-Base-Rally – A continuation pattern showing strong buyer presence.
Drop-Base-Drop – A continuation pattern showing strong seller presence.
These patterns help traders spot potential entry and exit points.
Here are some practical supply and demand trading strategies:
To use this approach effectively, traders should follow these supply and demand trading rules:
Identify fresh zones before placing trades.
Trade with the overall market trend for higher probability setups.
Use proper stop-loss orders below demand zones or above supply zones.
Avoid trading near major economic announcements where zones may break unexpectedly.
Combine supply and demand analysis with volume, candlestick patterns, or moving averages for confirmation.
Clear Framework: Provides logical zones for entries and exits.
Works Across Assets: Useful in stocks, forex, commodities, and indices.
Risk Management: Zones allow for precise stop-loss placement.
Market Structure Insights: Helps traders understand the psychology of buyers and sellers.
While powerful, this method has some drawbacks:
Zones may not always hold, especially during strong trends or news events.
Requires practice to correctly identify reliable zones.
Works best when combined with other tools, rather than used in isolation.
Supply and demand trading gives traders an effective way to analyze price action and forecast potential reversals. By recognizing supply demand zones, studying chart patterns, and following structured trading rules, investors can make more informed decisions.
However, no strategy is foolproof. Using supply and demand alongside risk management and complementary indicators increases the probability of success.
It refers to how buying (demand) and selling (supply) pressures affect the price of an asset in financial markets.
It is a price area where strong buying or selling previously occurred, leading to reversals or continuation of trends.
Traders use these patterns to identify areas where price may bounce, reverse, or break out, guiding entry and exit decisions.
The key rules include identifying fresh zones, trading with the trend, setting stop-losses at logical levels, and confirming signals with other indicators.
Calculate your Net P&L after deducting all the charges like Tax, Brokerage, etc.
Find your required margin.
Calculate the average price you paid for a stock and determine your total cost.
Estimate your investment growth. Calculate potential returns on one-time investments.
Forecast your investment returns. Understand potential growth with regular contributions.

You have successfully submitted your partnership request form. You will be hearing us soon!