17 Jul, 2025
 4 mins read
Before investing in a stock, savvy investors look beyond earnings and valuations. One of the most telling indicators of a company’s financial strategy and dividend policy is the payout ratio. Whether you’re investing for regular income or capital growth, understanding what is payout ratio can help you make better financial decisions.
In this blog, we’ll break down the payout ratio meaning, explain how to calculate payout ratio, interpret its significance, and walk you through a practical payout ratio example.
The payout ratio is the percentage of a company’s net income that is distributed to shareholders in the form of dividends. It tells you how much of the company’s profit is being returned to investors versus how much is retained for reinvestment or debt repayment.
Simple Example:
If a company earns ₹100 in profits and pays ₹40 in dividends, the payout ratio is:
Payout Ratio = (₹40 ÷ ₹100) × 100 = 40%
This metric is especially relevant for dividend-focused investors and helps assess the sustainability of a company’s dividend policy.
There are two commonly used formulas to calculate the payout ratio:
Formula 1: Using Aggregate Financial Data
|
Payout Ratio (%) = (Dividends Paid ÷ Net Income) × 100 |
This version is ideal for evaluating the company’s overall dividend distribution strategy.
Formula 2: Using Per-Share Metrics
|
Payout Ratio (%) = (Dividend per Share ÷ Earnings per Share) × 100 |
This method is useful when analysing stocks on a per-share basis, especially for listed companies.
Interpreting the payout ratio depends on the company’s industry, maturity, and financial priorities:
Low Payout Ratio (0–30%)
Indicates that the company is reinvesting most of its profits to fund growth. Common in startups and tech companies.
Moderate Payout Ratio (30–60%)
Reflects a balanced approach—returning value to shareholders while retaining enough for expansion.
High Payout Ratio (Above 60%)
Typical of mature companies with steady cash flows. However, if the ratio approaches or exceeds 100%, it may signal unsustainable dividend payouts or cash flow constraints.
Knowing how to calculate payout ratio is just the beginning. Here's how investors use it to make smarter decisions:
Dividend Reliability
A stable payout ratio over time indicates consistent dividend payments.
Growth vs Income Strategy
Growth companies usually retain profits (low payout), while income stocks distribute more (high payout).
Financial Strength Check
A rising payout ratio without rising earnings could indicate risk.
Peer Comparison
Comparing payout ratios within the same sector can help evaluate relative performance and policy.
Plowback Ratio: The Complement to Payout Ratio
The plowback ratio, also known as the retention ratio, shows the percentage of profits retained in the business rather than paid out as dividends.
Plowback Ratio Formula
|
Plowback Ratio (%) = 100 – Payout Ratio (%) |
Example:
If the payout ratio is 40%, the plowback ratio is:
100 – 40 = 60%
This means the company retains 60% of its profits for internal use such as R&D, expansion, or debt repayment.
Let’s look at two examples for better understanding:
Example 1: Per-Share Method
Earnings per Share (EPS) = ₹20
Dividend per Share (DPS) = ₹8
Payout Ratio = (8 ÷ 20) × 100 = 40%
Example 2: Company-Level Calculation
Net Income = ₹100 crore
Dividends Paid = ₹30 crore
Payout Ratio = (30 ÷ 100) × 100 = 30%
This means the company distributes 30% of its profits and retains 70%, which suits firms balancing growth and shareholder returns.
There’s no universally “ideal” payout ratio. What’s considered good varies by sector and business model:
Mature companies: 50 - 70%
High-growth firms/startups: 0 - 30% or even 0%
Balanced policy: 30 - 60%
The key is to look at the trend over time and whether earnings are also rising.
The payout ratio might seem like just another financial metric, but it actually tells you a lot about a company’s dividend policy and overall financial health. A high payout ratio can look tempting after all who doesn’t like steady income? But it’s worth asking - is that dividend actually sustainable? How much of the profits are being reinvested? And does all this line up with where the company’s headed?
To make better investment decisions:
Make sure you’re using the payout ratio formula correctly
Compare it with peers and industry averages
Pair it with other metrics like ROE, free cash flow, and the plowback ratio
Whether you’re in it for the income or playing the long game, the payout ratio is a solid piece of the puzzle when you're figuring out where to put your money.
It’s the percentage of a company’s earnings paid to shareholders as dividends.
Not always. While attractive to income investors, it may limit reinvestment and signal financial stress.
Typically, a 30-60% payout ratio is considered healthy, depending on the industry.
The plowback ratio is the complement of the payout ratio. It shows how much profit is retained.
Plowback Ratio = 100 – Payout Ratio
Calculate your Net P&L after deducting all the charges like Tax, Brokerage, etc.
Find your required margin.
Calculate the average price you paid for a stock and determine your total cost.
Estimate your investment growth. Calculate potential returns on one-time investments.
Forecast your investment returns. Understand potential growth with regular contributions.
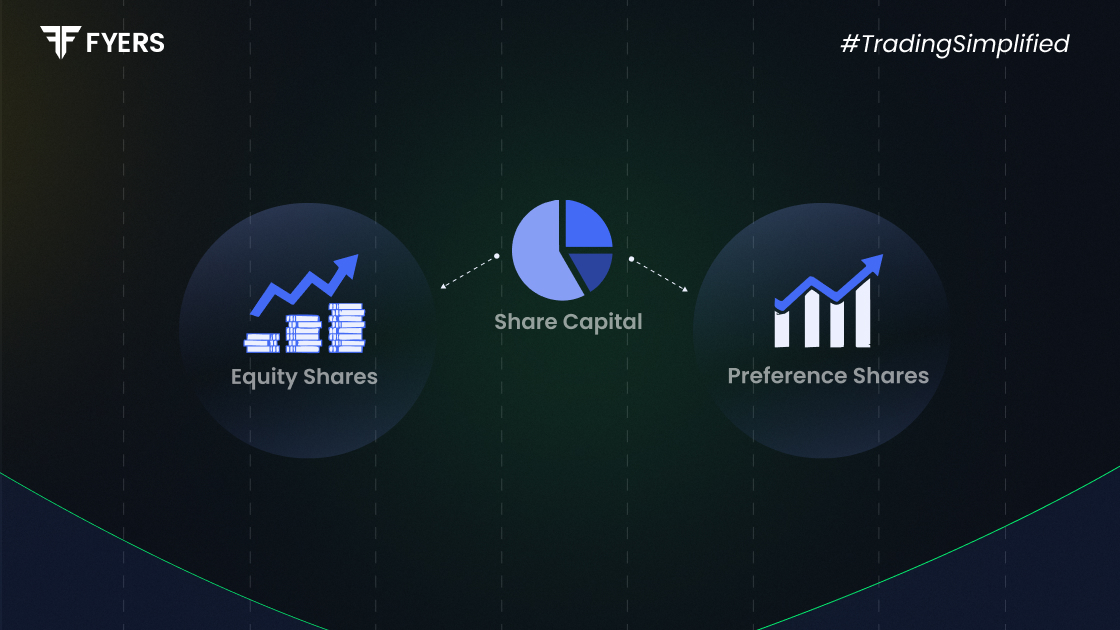
When a company is formed or plans to expand, one…
31 Jul, 2025
4 mins read

You have successfully submitted your partnership request form. You will be hearing us soon!