10 Jul, 2024
 6 mins read
Understanding market volatility and leveraging it is essential for successful stock trading. Traders use various indicators and tools, such as charts and candlesticks, to analyse market movements. Among these tools, Bollinger Bands is a more sophisticated alternative to simple moving averages for market analysis. Check out this blog to learn more about Bollinger Bands and how to trade using various strategies.
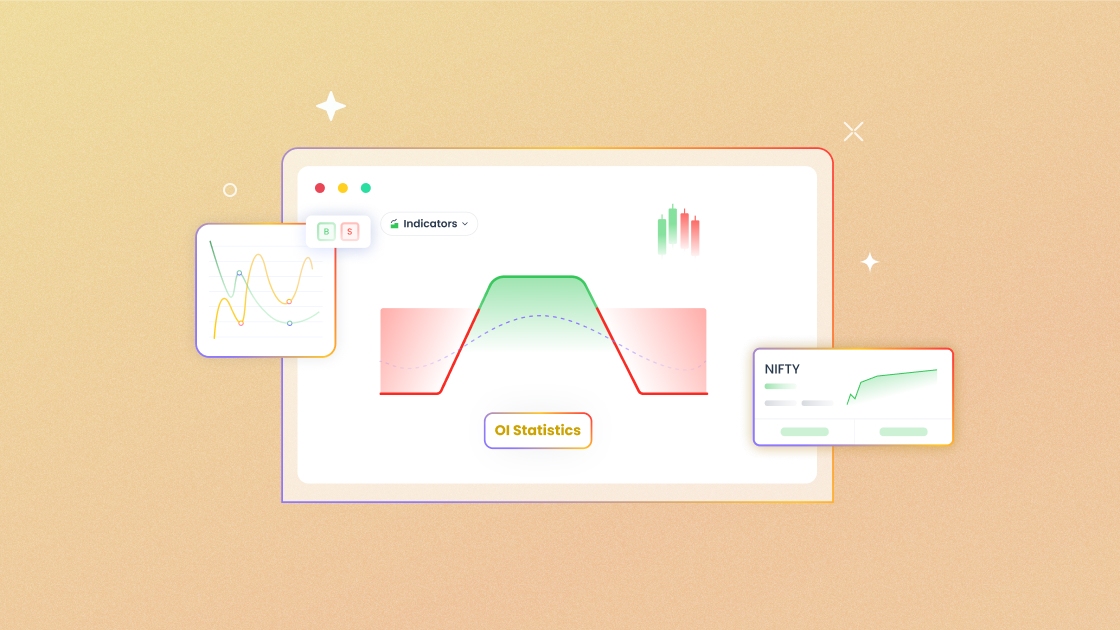
Bollinger Bands are a popular technical analysis tool used by traders to measure market volatility and identify potential trading opportunities. It was created by John Bollinger in the early 1980s.
These bands consist of a middle band, which is a simple moving average (SMA) and two outer bands that are standard deviations away from the SMA. The distance of the outer bands from the middle band changes based on the market volatility, i.e., expanding during high volatility and contracting during low volatility, helping traders visualize price trends and potential reversal points. Bollinger Bands can identify overbought and oversold conditions in the market, enabling traders to make more informed decisions on when to enter or exit trades.
The calculation of Bollinger Bands includes three components,
Middle Band = SMA(20)
Upper Band = SMA(20) + [2×Standard Deviation(20)]
Lower Band = SMA(20) − [2×Standard Deviation(20)]
When the price touches or exceeds the upper Bollinger Band, it indicates an overbought condition, suggesting a potential sell opportunity. Conversely, when the price touches or falls below the lower Bollinger Band, it indicates an oversold condition, suggesting a potential buy opportunity.
A Bollinger Band Squeeze occurs when the bands are narrow, indicating low volatility and the potential for a breakout. Traders should wait for a breakout above the upper band or below the lower band to enter a trade in the direction of the breakout.
A reversal can be identified when the price moves from one band to the opposite band. Traders should consider entering a trade when the price reverses direction after hitting one of the bands and aiming for a move towards the middle band.
Traders should place stop losses just outside the Bollinger Bands to limit risks. Traders should target the middle band or the opposite band, depending on the trade direction for profit taking.
Day trading uptrends with Bollinger Bands involve using these bands to identify and capitalise on sustained upward price movements within a single trading day. In an uptrend, day traders look for the price to consistently hover near or above the upper band, indicating strong bullish momentum.
Traders can identify entry points when the price returns to the middle band (SMA) or slightly below it. These pullbacks offer lower-risk buying opportunities, allowing traders to join the uptrend at more favourable prices. The middle band acts as a dynamic support level during an uptrend, and buying during these pullbacks can help minimise risk while maximising the profit potential. This approach helps traders buy on dips during a strong upward move.
Traders should include confirmation signals from other technical indicators, such as the Relative Strength Index (RSI) in their trading strategy to ensure that the uptrend is supported by broader market strength. Furthermore, traders should place stop-loss orders just below the middle band or recent lows to protect against unexpected reversals. This strategy helps limit potential losses and preserve capital.
Day trading downtrends with Bollinger Bands involve leveraging these indicators to identify and profit from sustained downward price movements within a single trading day. Prices consistently stay near or below the lower Bollinger Band in a downtrend, which signals strong bearish momentum.
Traders can use this information to enter short positions or sell trades during pullbacks to the middle band (SMA) or slightly above it. These pullbacks offer lower-risk selling opportunities, allowing traders to profit from downward movements while minimising risk. The middle band acts as dynamic resistance during a downtrend, providing optimal entry points for short positions.
Similar to trading in an uptrend, confirmation with other indicators like the RSI is crucial in verifying the strength of the downtrend and avoiding false signals. Traders can employ effective risk management strategies by placing stop-loss orders just above the middle band or recent highs to mitigate losses in case of unexpected reversals. This strategy helps limit potential losses and ensures capital preservation, allowing traders to navigate downtrends more effectively.
Although the Bollinger Bands indicator is one of the most effective and popular trading indicators, it is not free from limitations. Here is a list of some limitations traders may face when using Bollinger Bands.
Delayed Signals: Bollinger Bands are based on historical price data, so they may provide delayed signals, especially during rapid market changes or sudden news events.
Not Suitable for All Market Conditions: Bollinger Bands' strategy works best in trending markets but may be less effective in ranging or highly volatile conditions. Traders should, therefore, use additional indicators for confirmation.
Lack of Predictive Power: While Bollinger Bands help identify potential price levels, they do not predict future price movements with certainty. Traders, therefore, need to exercise caution and proper risk management when trading with Bollinger Bands indicator.
Cannot be used as a Standalone Indicator: Bollinger Bands cannot be used as a standalone indicator to implement trading strategies without considering factors like fundamental analysis or market sentiment, as it can lead to suboptimal trading decisions.
Bollinger Bands are a valuable tool for traders, offering valuable insights into market volatility, trend identification, and potential entry and exit points. However, traders should also be aware of the limitations of using the Bollinger Bands indicator while including them in their trading strategies. Traders should use Bollinger Bands and other indicators to exercise caution during volatile periods and implement robust risk management strategies to make informed trading decisions.
Calculate your Net P&L after deducting all the charges like Tax, Brokerage, etc.
Find your required margin.
Calculate the average price you paid for a stock and determine your total cost.
Estimate your investment growth. Calculate potential returns on one-time investments.
Forecast your investment returns. Understand potential growth with regular contributions.

You have successfully submitted your partnership request form. You will be hearing us soon!