26 Aug, 2025
 4 mins read
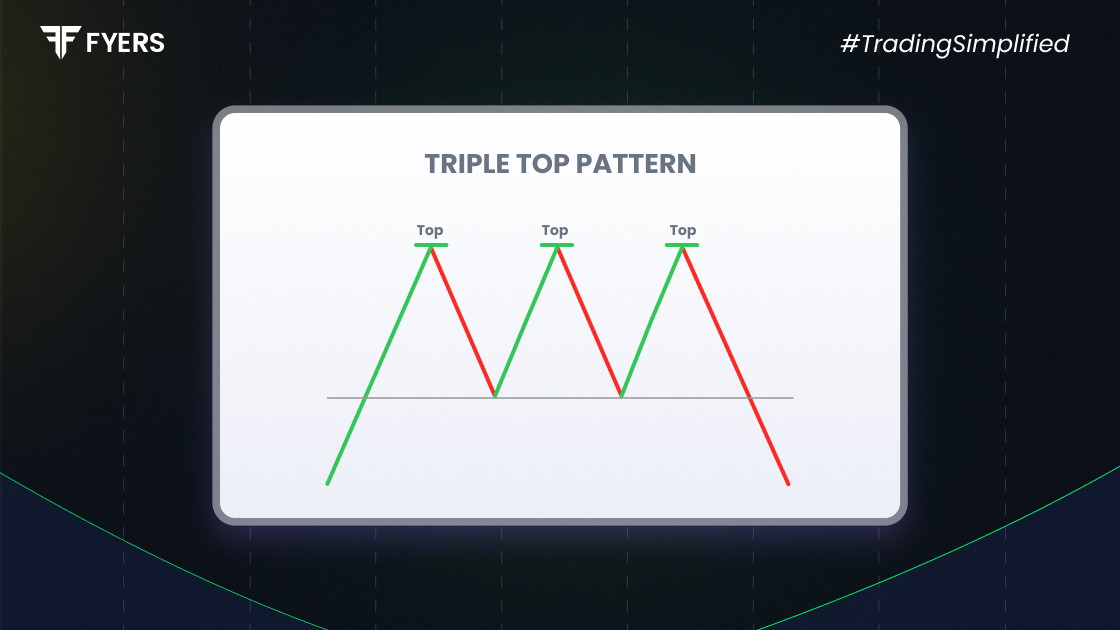
Chart patterns play a crucial role in technical analysis. Among them, the triple top pattern is known for signalling a potential reversal from an uptrend to a downtrend. But recognising this pattern correctly is key to using it effectively. In this blog, we’ll break down what is triple top pattern, how it works, how to spot it, and what traders typically look for when using it.
The triple top pattern is a bearish reversal pattern that appears on a price chart. It forms when the price hits a similar resistance level three times, with pullbacks in between. This indicates that buyers are losing strength each time they try to push prices higher.
Each of the three highs occurs around the same price level, showing strong resistance. After the third peak, if the price falls below the support line (also called the neckline), the pattern is considered complete.
This pattern often suggests that the upward momentum has ended, and a downward trend may follow.
To understand the triple top chart pattern, it’s helpful to break down the sequence:
First Peak: The price rises to a resistance level and then drops due to selling pressure.
Second Peak: The price climbs again to the same resistance but faces another rejection.
Third Peak: One more rally takes the price near the same resistance zone. Again, sellers push it down.
Neckline Break: After the third fall, if the price breaks below the neckline (support formed between the lows), it confirms the bearish pattern.
This tells traders that the buyers have failed three times to push past the resistance, and sellers may now take control.
Identifying the triple top candlestick pattern involves spotting three distinct peaks that touch a similar price level. Here’s how to do it:
Trend: The pattern must form after a clear uptrend.
Three Highs: Price reaches roughly the same resistance point three times.
Volume Decline: Volume usually reduces with each peak.
Neckline Support: The lows between the peaks form a horizontal support (neckline).
Breakout Confirmation: The pattern is valid only when the price breaks below the neckline with volume.
Always use reliable charting tools and wait for a confirmed breakout to avoid false signals.
Understanding how to trade triple top pattern is important for managing risk. Here are the common steps:
Do not act after the third peak alone. Wait until the price closes below the neckline with increased volume.
Enter a short position or exit long positions once the neckline is broken.
Place a stop loss slightly above the third peak to protect against a false breakout.
Measure the distance from the neckline to the top of the peaks. Subtract this from the neckline to estimate the target.
Example:
If the peaks are at ₹200 and the neckline is ₹180, the height is ₹20. After a breakdown, the target price could be around ₹160.
The triple top chart pattern can provide important insights:
Reversal Signal: It warns of a possible trend change from bullish to bearish.
Psychological Barrier: The resistance level reflects strong seller activity.
Volume Clues: Lower volume on each rise indicates weaker buying interest.
Neckline Breakout: This confirms a shift in control from buyers to sellers.
As with all patterns, it’s better to use it along with indicators like RSI, MACD, or moving averages for stronger confirmation.
Clear Reversal Signal: Helps traders exit long positions or prepare for shorts.
Easy to Spot: Visually identifiable with basic charting tools.
Risk Control: Defined entry, stop loss, and target zones.
Psychological Insight: Reflects market sentiment shift.
False Breakouts: Breaks may occur but quickly reverse.
Time Consuming: Takes time to form, requiring patience.
Not Always Reliable: Needs volume confirmation and may fail without it.
Works Best with Other Tools: Should not be used in isolation.
The triple top pattern is a reliable reversal tool when used with patience and confirmation. It tells you that the market is failing to break through resistance, and a trend change may be coming. By learning how to identify triple top pattern, when to enter and exit, and combining it with indicators, traders can improve decision-making. Like any chart pattern, it's not foolproof, but with the right approach, it can be a valuable addition to your analysis toolkit.
A double top has two peaks while a triple top has three. Triple tops are often seen as stronger reversal signals due to more failed attempts to break resistance.
Yes, it can form in equities, forex, commodities, and crypto markets. It is more effective in liquid and trending markets.
Indicators like Relative Strength Index (RSI), Moving Average Convergence Divergence (MACD), and volume analysis can help confirm the pattern.
Calculate your Net P&L after deducting all the charges like Tax, Brokerage, etc.
Find your required margin.
Calculate the average price you paid for a stock and determine your total cost.
Estimate your investment growth. Calculate potential returns on one-time investments.
Forecast your investment returns. Understand potential growth with regular contributions.

You have successfully submitted your partnership request form. You will be hearing us soon!