31 Oct, 2025
 4 mins read

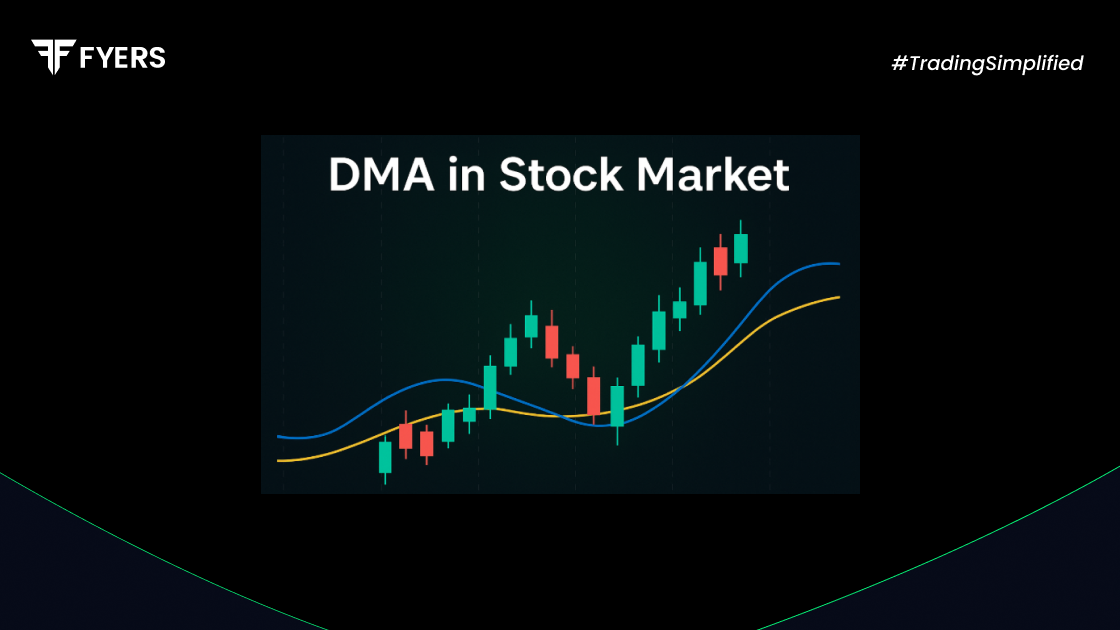
When it comes to analysing price trends in the stock market, moving averages are a go-to tool for many traders. Among the different types, the Exponential Moving Average (EMA) stands out for its responsiveness and reliability in identifying short- to medium-term price movements. In this blog, we’ll break down what EMA is, how it’s calculated, how it compares to the Simple Moving Average (SMA), and where it fits into your trading strategy.
An Exponential Moving Average (EMA) is a type of weighted moving average that assigns greater importance to the most recent price data. This characteristic makes EMA more responsive to recent price movements compared to its counterpart, the Simple Moving Average (SMA), which treats all data points equally.
EMA is widely used in technical analysis to identify trend directions, support and resistance levels, and potential buy or sell signals. Because it reacts more swiftly to market changes, traders often use it to capture short-term opportunities in volatile markets.
The calculation of EMA involves a smoothing factor that determines how much weight is given to the most recent price. The formula is:
| EMA = (Price_today × k) + (EMA_yesterday × (1 – k)) |
Where:
Price_today = Current closing price
EMA_yesterday = EMA value from the previous period
k = Smoothing factor = 2 / (n + 1)
n = Number of periods
This recursive formula ensures that more weight is given to recent prices, with the influence of older prices decreasing exponentially over time.
To manually calculate the EMA, follow these steps:
Choose your period – Common periods include 10, 20, or 50 days depending on your trading timeframe.
Calculate the SMA for the first EMA value – Since EMA requires a previous EMA value, the first data point is usually a Simple Moving Average.
Apply the EMA formula – Use the recursive formula on each subsequent data point.
Example:
Suppose you want to calculate a 10-day EMA for a stock. First, compute the 10-day SMA using the closing prices. Then apply the formula using a smoothing factor of 2 / (10 + 1) = 0.1818 for the next data point, and continue this for the following days.
Most trading platforms and charting software do this automatically, so you rarely need to do it manually. But understanding the process helps in tweaking your strategy effectively.
Here’s a quick comparison between Simple Moving Average (SMA) and Exponential Moving Average (EMA):
|
Feature |
SMA |
EMA |
|---|---|---|
|
Weighting |
Equal for all data points |
More weight to recent prices |
|
Responsiveness |
Slower to respond |
Faster reaction to price changes |
|
Lag |
Higher |
Lower |
|
Preferred use case |
Long-term trends |
Short to medium-term trading |
EMA’s responsiveness gives traders an edge in capturing momentum early, while SMA offers a smoother trend line for broader analysis.
EMA provides several benefits that make it a favourite among technical analysts:
Quick reaction to price changes – EMA’s weighting system makes it ideal for identifying short-term trend reversals.
Better support/resistance zones – Because of its sensitivity, EMAs often align more closely with key price zones.
Useful in crossover strategies – Popular strategies like the 9- and 21-day EMA crossover use EMAs to generate entry and exit signals.
Adaptability – EMAs can be used across different timeframes, from intraday trading to swing strategies.
While EMA is a powerful tool, it’s not foolproof. Here are some limitations:
False signals in sideways markets – EMAs can produce unreliable signals when the market lacks a clear trend.
Requires confirmation – Relying solely on EMA can lead to premature decisions. It’s best used in combination with other indicators like RSI or MACD.
Sensitive to short-term volatility – While this can be an advantage, it also means that EMAs may trigger trades based on noise rather than real momentum.
Traders should always interpret EMA signals in the broader context of market conditions and other technical indicators.
The Exponential Moving Average is a vital component of any trader’s toolkit. Its ability to adapt quickly to price changes makes it especially useful in volatile market environments. However, like all indicators, it works best when combined with a comprehensive trading plan and proper risk management. Whether you're an intraday trader or a swing investor, understanding and utilising EMA effectively can help you make more informed decisions.
Neither is universally better - it depends on your trading style. EMA is more responsive and suited for short-term trading, while SMA is better for identifying long-term trends. Most traders use both together for a balanced view.
EMA can help generate signals, especially when using crossovers or price breakouts above/below the EMA line. However, relying solely on EMA may lead to false signals. It’s best to use it alongside other indicators like MACD, RSI, or volume analysis for confirmation.
Not effectively. In sideways or range-bound markets, EMA tends to produce more whipsaws and false signals due to constant price fluctuations. In such cases, oscillators like RSI or Bollinger Bands may provide better guidance.
Calculate your Net P&L after deducting all the charges like Tax, Brokerage, etc.
Find your required margin.
Calculate the average price you paid for a stock and determine your total cost.
Estimate your investment growth. Calculate potential returns on one-time investments.
Forecast your investment returns. Understand potential growth with regular contributions.

You have successfully submitted your partnership request form. You will be hearing us soon!