25 Sep, 2025
 3 mins read
Every investor has a toolkit. Some rely on numbers, balance sheets, and industry trends, while others spend hours studying charts and patterns. The difference between fundamental and technical analysis lies in how each approach looks at the market. One digs into the strength of a business, while the other tracks the pulse of price movements. Both can be powerful if used wisely, and knowing when to apply them is what separates a thoughtful investor from a reckless one.
Fundamental analysis studies a company’s overall health to determine its true value. It focuses on both financial and qualitative factors to assess whether a stock is undervalued or overvalued.
Financial reports: Balance sheet, income statement, and cash flow
Ratios: Price-to-earnings (P/E), return on equity (ROE), debt-to-equity
Qualitative factors: Business model, management quality, competitive position
Economic data: Interest rates, GDP growth, and inflation trends
This approach is most common among long-term investors who aim to hold strong companies for years. Well-known investors like Warren Buffett are advocates of fundamental analysis.
Technical analysis focuses on price and volume rather than the company itself. It assumes that market behaviour, reflected in charts and patterns, can help predict future price movements.
Charts: Line, bar, and candlestick charts
Indicators: Moving averages, RSI (Relative Strength Index), MACD (Moving Average Convergence Divergence)
Patterns: Head and shoulders, double tops, triangles
Volume study: Used to confirm price trends
Technical analysis is especially popular with short-term traders who need precise entry and exit points.
Here’s how the two methods compare:
|
Aspect |
Fundamental Analysis |
Technical Analysis |
|---|---|---|
|
Focus |
Company’s value and health |
Price trends and patterns |
|
Time frame |
Long-term |
Short to medium-term |
|
Tools |
Financial reports, ratios, economic data |
Charts, indicators, price patterns |
|
Goal |
Identify undervalued or overvalued stocks |
Predict short-term price movements |
|
Data type |
Financial and qualitative |
Market price and volume |
Both approaches serve different purposes, and some investors combine them for stronger decisions.
Long-term goals: Best for those looking to invest for years
Understanding business quality: Helps identify stable, profitable companies
Following economic cycles: Useful for a broader perspective on industries and markets
Quick trades: Suited for intraday trading or short-term swings
Timing the market: Assists in finding optimal entry and exit points
Fast-moving markets: Handy when prices change rapidly and decisions must be quick
Many investors combine the two. For example, they may select a fundamentally strong company and then use technical analysis to decide the right time to buy. This way, they get the security of sound business evaluation along with sharper market timing.
Investing is never one-size-fits-all. Fundamental analysis helps you see the strength of a business, while technical analysis captures the rhythm of the market. A long-term investor may lean on fundamentals, a trader may live by charts, and many blend both for balance. Understanding how each works gives you the freedom to choose the approach that matches your style and goals.
Yes, many professionals use a mix of both. They evaluate a company’s value using fundamental analysis and rely on technical tools to fine-tune entry and exit points.
Begin with the basics of finance to understand balance sheets and income statements for fundamental analysis. For technical analysis, start with simple charts and indicators. Books, online courses, and demo trading platforms can help you practise.
Yes, it can be effective for short-term trading, as it focuses purely on price behaviour. However, it does not reveal whether the company is strong in the long run. For a complete picture, many investors prefer to consider both methods.
Calculate your Net P&L after deducting all the charges like Tax, Brokerage, etc.
Find your required margin.
Calculate the average price you paid for a stock and determine your total cost.
Estimate your investment growth. Calculate potential returns on one-time investments.
Forecast your investment returns. Understand potential growth with regular contributions.
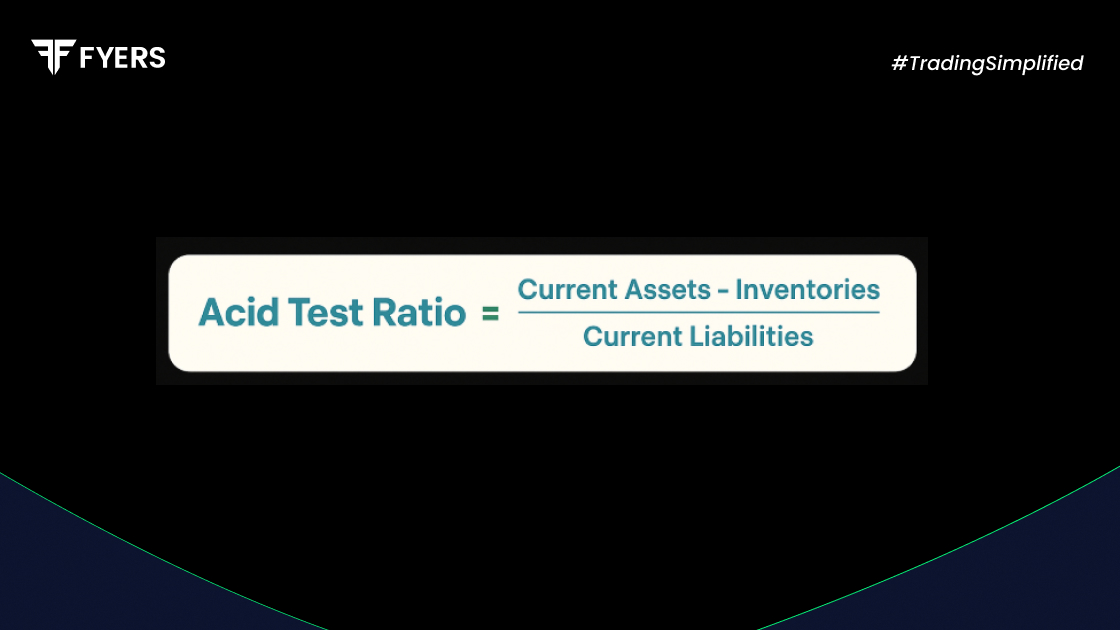
The acid test ratio is like a financial stress test…
24 Sep, 2025
4 mins read

You have successfully submitted your partnership request form. You will be hearing us soon!