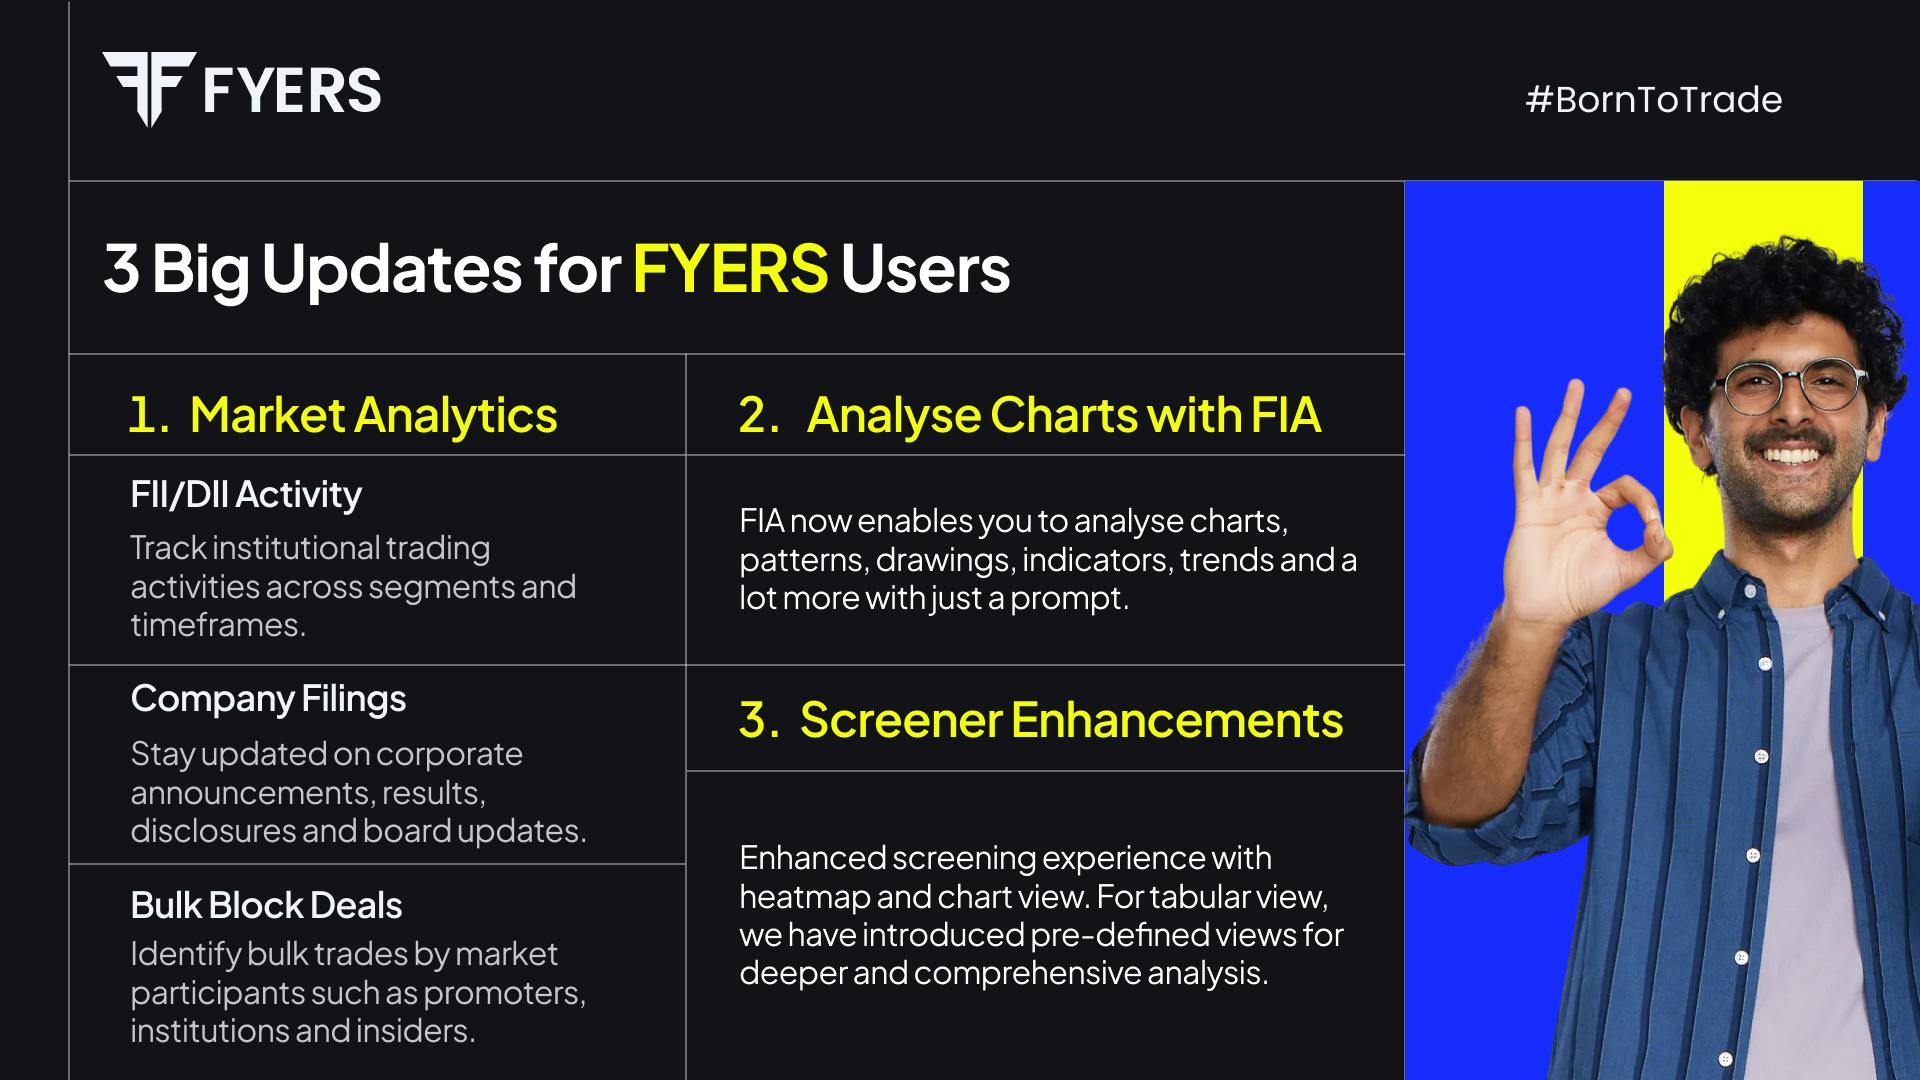
Markets move quickly, information is dense, and time is limited. Over the last few months, we’ve focused on improving how you see the market and how quickly you can move from context to decision.
These three updates work together to reduce friction in that process.
1. Market Analytics: See the market clearly
Market Analytics brings multiple market-wide views into one place, so you don’t have to piece together context from different tools. It’s designed to help you understand what’s moving, where strength or weakness is building, and who is participating.
Heatmap
A grid-based visual that shows stock performance at a glance. It helps you quickly see which stocks are rising or falling, how broad the move is, and where strength is concentrated.
*Learn more: *Visualise the Market with FYERS Heatmaps
Bubble chart
A visual scan where each stock appears as a bubble sized by volume or delivery and coloured by return. This makes it easier to spot unusual activity and standout moves without scanning long tables.
*Learn more: *Introducing Bubble Charts – A New Way to Scan the Markets
Sector heatmap
A view of how entire sectors are performing relative to each other. It helps you quickly identify sector rotation and understand where momentum is building or fading.
*Learn more: *Spot the Rotation with Sector Heatmaps
FII/DII activity
A dedicated section to track institutional participation across cash and derivatives. It adds context to price moves by showing whether large participants are accumulating, reducing exposure, or staying neutral.
*Learn more: *Track the Big Money with FII & DII Activity
Company filings
A consolidated feed of official exchange disclosures such as results, board decisions, and regulatory announcements. This helps you stay informed about material updates directly from the source.
*Learn more: *Stay Updated with Company Filings on FYERS
Bulk/Block deals
A tracker for large transactions involving institutions, promoters, and other major participants. Useful for understanding sudden activity or changes in ownership that may not be obvious on charts alone.
*Learn more: *Track Bulk and Block Deals on FYERS
2. Screener enhancements: Spot opportunities without the clutter
Screeners were already part of FYERS. The recent updates focus on making them easier to navigate and faster to use.
With clearer categories, visible screener logic, and multiple views including heatmaps, screeners now help you identify relevant setups without scanning endless lists or second-guessing why a stock appears.
*Learn more: *Making Your Market Research Sharper with Screeners
3. Analyse charts with FIA: Faster chart reads with a simple prompt
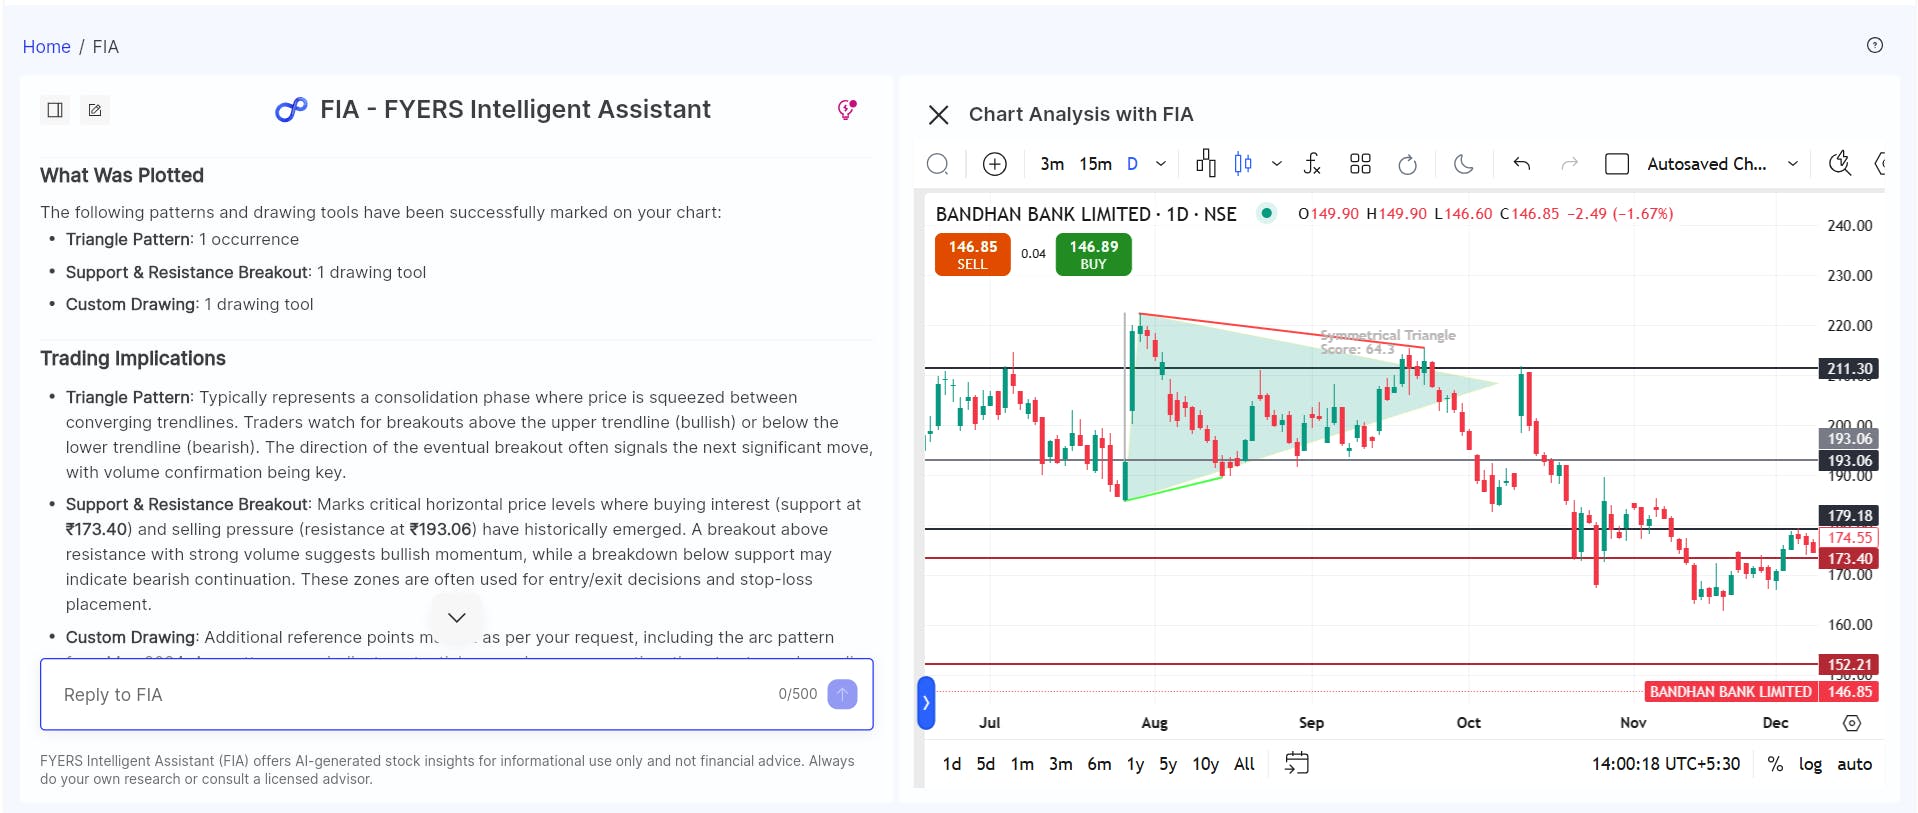
Chart analysis often involves repeating the same steps across symbols: adding indicators, checking patterns, marking levels, and reading structure.
FIA reduces this manual work by interpreting chart patterns, indicators, drawings, and trend context directly on the chart. Instead of spending time preparing the chart, you can focus on evaluating the trade.
*Learn more: *Analyse Charts Easily with FIA
Each of these updates is meant to remove small but repeated frictions from your daily workflow. Used together, they help you move from market context to trade decisions with more clarity and less effort.
 how to pattern scaning on FIA make a videos