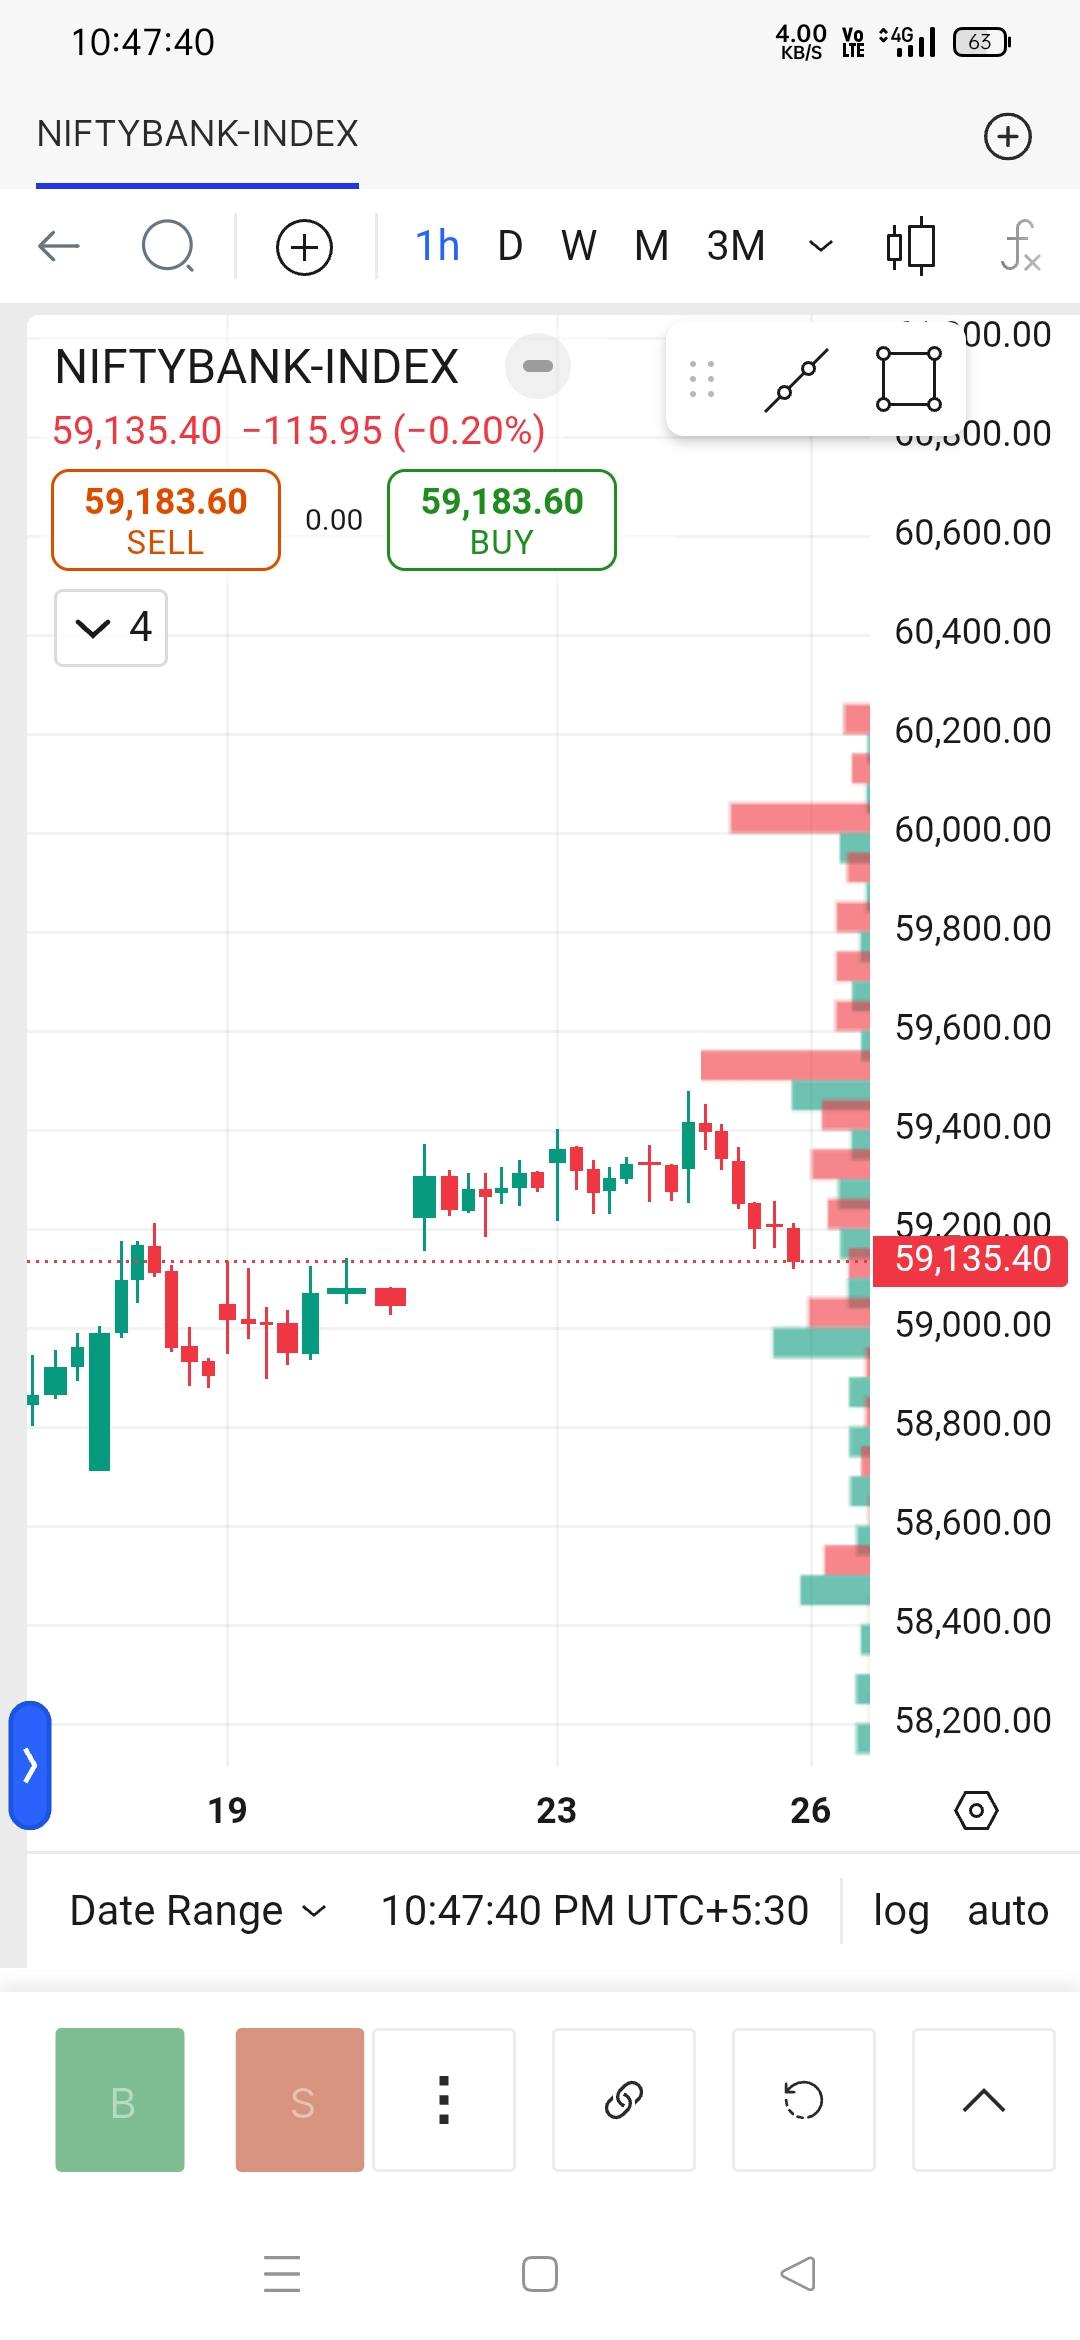
Have you ever opened a chart full of drawings and indicators and wondered what actually matters right now?
Or opened an options chain, saw rows of numbers, and felt unsure where to focus first?
Traders spend a lot of time preparing. Scanning price action, marking levels, checking indicators. If you trade options, that effort increases further as you track open interest, volume, and Greeks together. In a fast market, this preparation itself can lead to missed opportunities.
That’s why we built FIA (FYERS Intelligent Assistant). An AI-powered market co-pilot designed to help you reach clarity faster.
With the latest upgrade, FIA goes beyond displaying data. It analyses charts and options chains and presents insights in a structured way, without changing how you trade.
https://www.youtube.com/watch?v=6f0q8l3-HvA

What FIA Helps You Do
FIA brings common chart tasks into one place and lets actions happen directly from the chart you are viewing. Instead of switching between tools or repeating steps, FIA helps with:
- Get quick context on the current chart
- Apply indicators in one step
- Mark key levels and structure faster
- Spot candlestick patterns without scanning manually
The focus stays on analysis, not preparation. The workflow stays consistent whether you are studying one symbol or moving across multiple symbols.
Chart Analysis
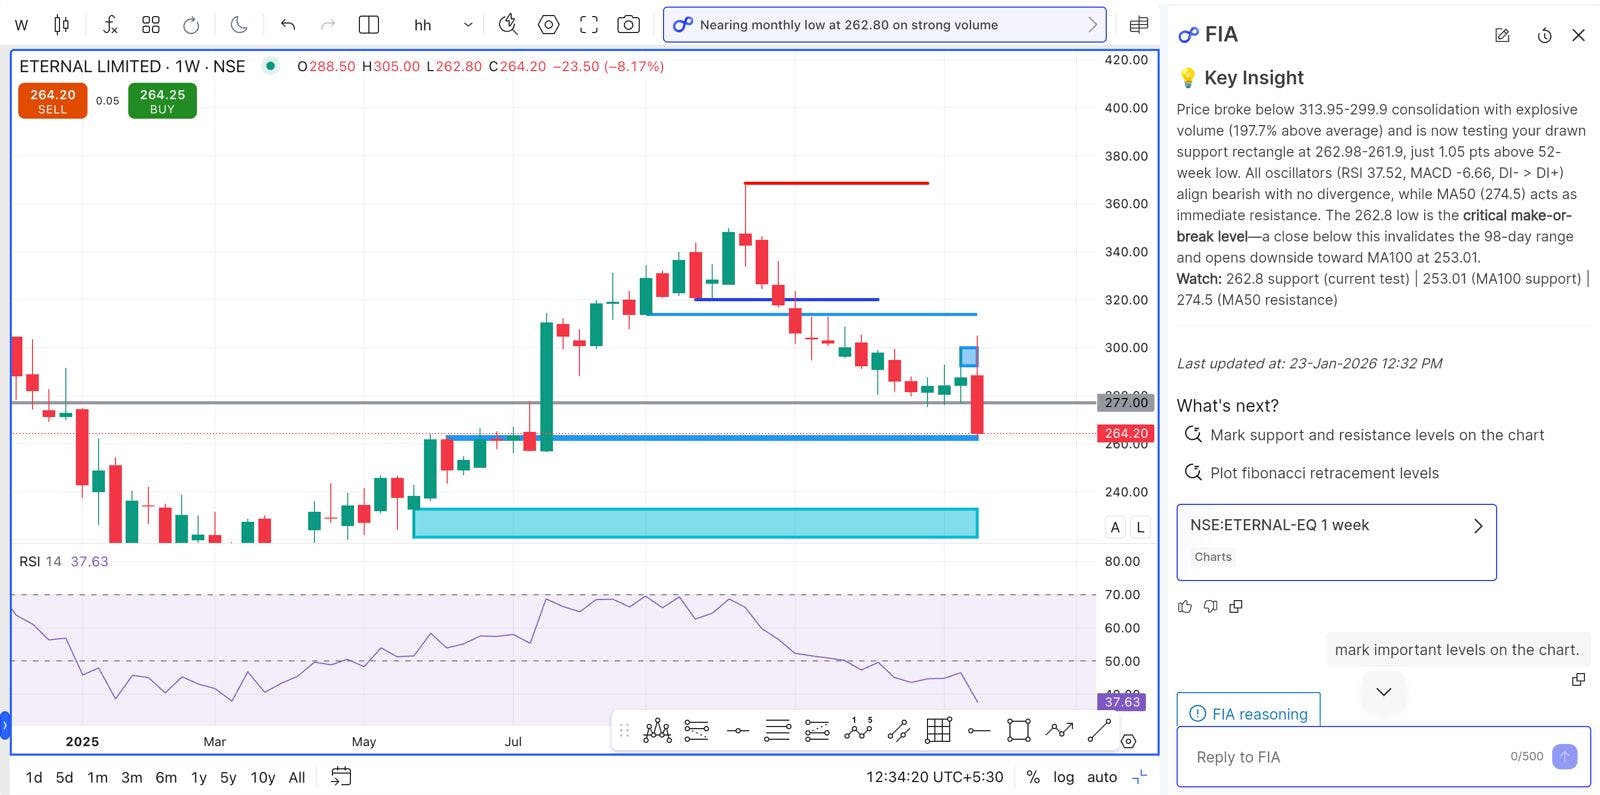
FIA analyses the chart exactly as you see it. Your drawings, indicators, and selected timeframe are already included.
Instead of starting fresh on every symbol, you get a structured summary covering price action, key support and resistance levels, trend strength, and overall technical structure.
For example, if you are analysing NIFTY on a 15-minute chart with trendlines and moving averages already drawn, FIA reads that context and explains what price is doing around those levels. You spend less time setting up and more time analysing.
Apply Multiple Indicators In One Go
Indicators work best as confirmation, not as standalone signals. But adding them one by one breaks flow.
With FIA, you can apply your usual indicator set in a single step. RSI, moving averages, MACD. All added together, consistently, every time.
This keeps your workflow clean and uninterrupted, especially when you are scanning multiple charts during market hours.
Analyse Candlestick Patterns
Candlestick patterns offer quick insight into market behaviour, but manually scanning candles across symbols takes time.
FIA identifies relevant candlestick patterns directly on the chart you are viewing. This helps you spot formations faster and keeps your focus on interpretation, not on searching candle by candle.
If a reversal or continuation pattern is forming near an important level, you see it immediately in context.
Options Chain Analysis
FIA now brings the same intelligence to the options chain.
When you open the options chain for any symbol and click the FIA icon, you get a structured summary instead of raw numbers.
FIA highlights:
- Market context: A quick view of the current environment
- Call and put activity: Where participation is building
- Key strike levels: Strikes that matter the most
- ATM Greeks analysis: How Delta, Theta, and Gamma are behaving around ATM
- Buyer and seller cues: Where pressure is starting to build
For instance, instead of manually checking multiple strikes, you can quickly understand where option writers or buyers are active and how Greeks are influencing near-ATM positions.
If you want to go deeper into how FIA works or explore frequently asked questions, check out the FAQ section.
Why This Matters
Trading already demands enough mental effort.
Your focus should be on risk management, timing, and execution. Not on repeatedly drawing levels or clicking through indicator lists.
FIA reduces that friction. It does not tell you what to trade or override your judgment. It simply helps you understand charts and options chains faster, so more of your attention goes into decisions, not preparation.
Try it on your favourite stock today. Open a chart on FYERS, click FIA, and see how quickly you can get to the “why” behind a trade.