October has been one of our strongest months for product releases at FYERS, with some of the most significant additions we’ve made to the platform this year. We’ve brought together major updates that give you a deeper view of the markets, more flexibility in how you trade, and new ways to work with your charts. Many of these capabilities have been in the works for some time, and we’re glad they’re now available for you to explore.
These updates build on the momentum from last month, when we introduced FIA, Order Flow, and Smart Screener. You can catch up on everything we shipped in our September 2026 Product Recap blog.
Here’s everything we launched in October.
Build Your Own Indicators With Smart Script
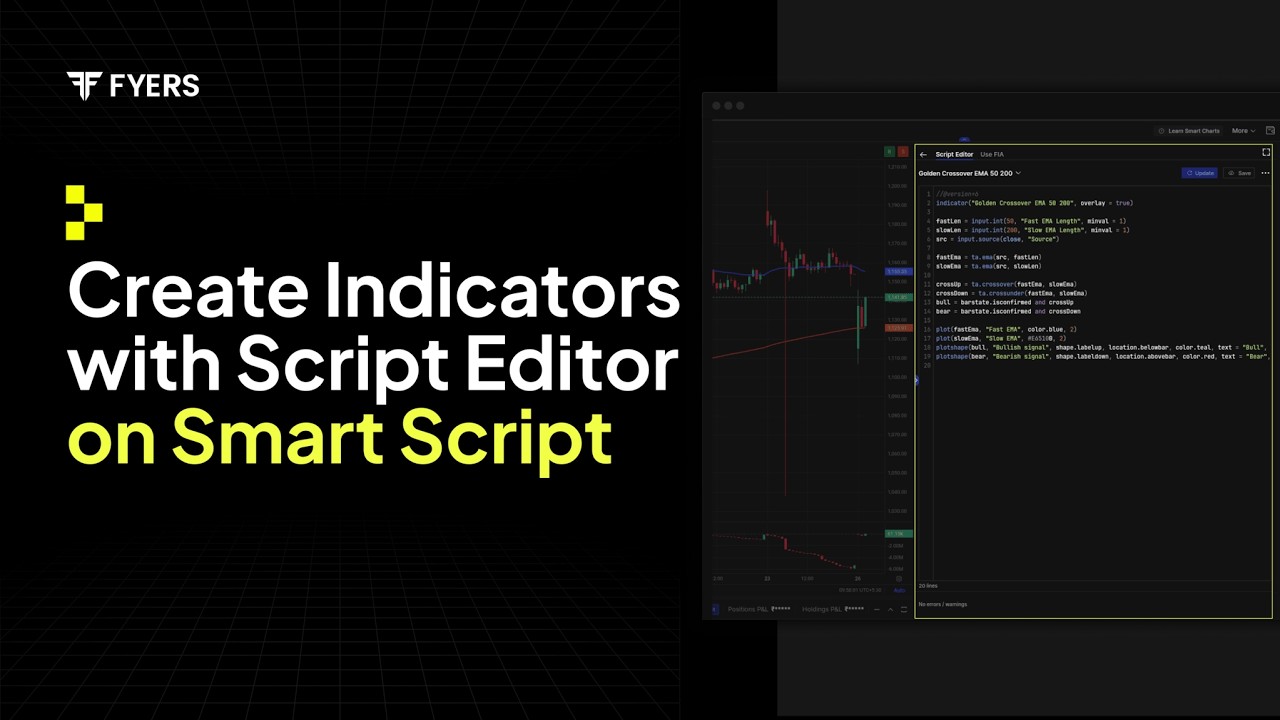
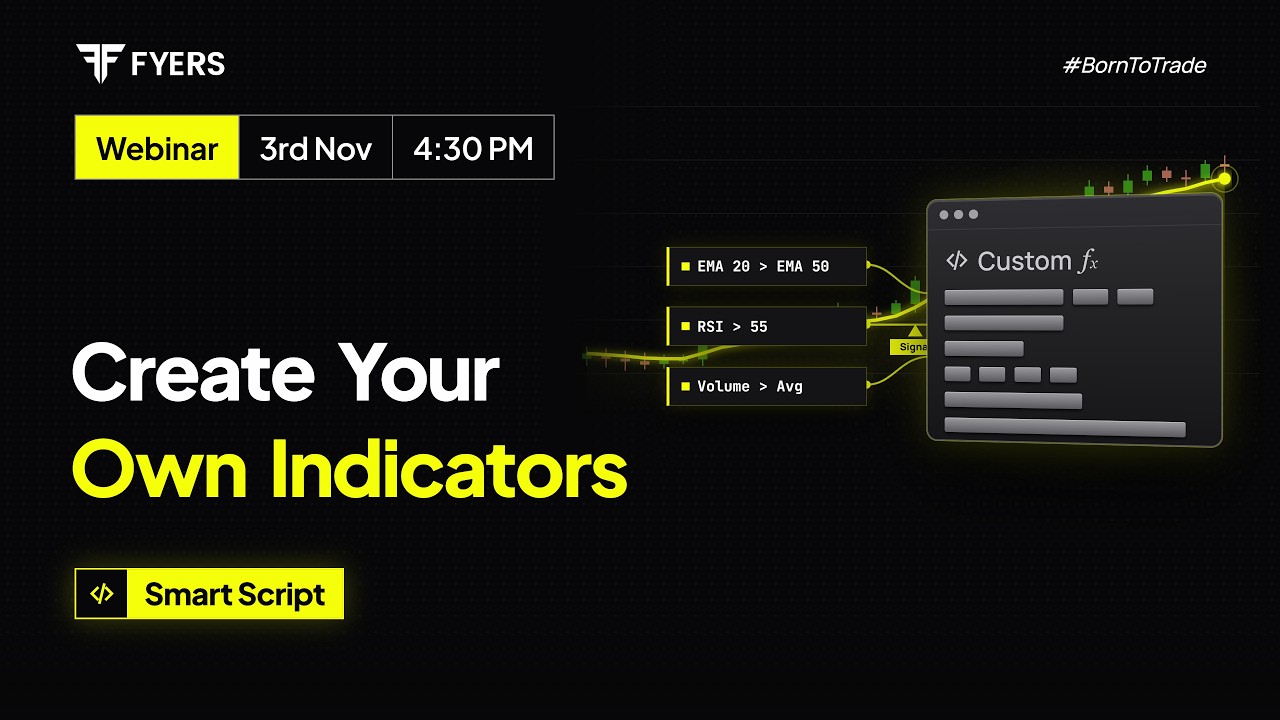
We’ve introduced Smart Script on Smart Charts, allowing you to create custom indicators based on your own trading conditions and calculations. You can write your logic using the Script Editor or simply describe what you want to FIA, which can help you build the indicator without writing code.
For example, if you want an indicator that combines a 20-period moving average crossover with an RSI condition, you can bring both into a single custom script instead of tracking them separately. You can also save, edit, and manage your indicators under My Smart Scripts for future use. Learn more about Smart Script.
See Resting Buy and Sell Orders With Liquidity Lens
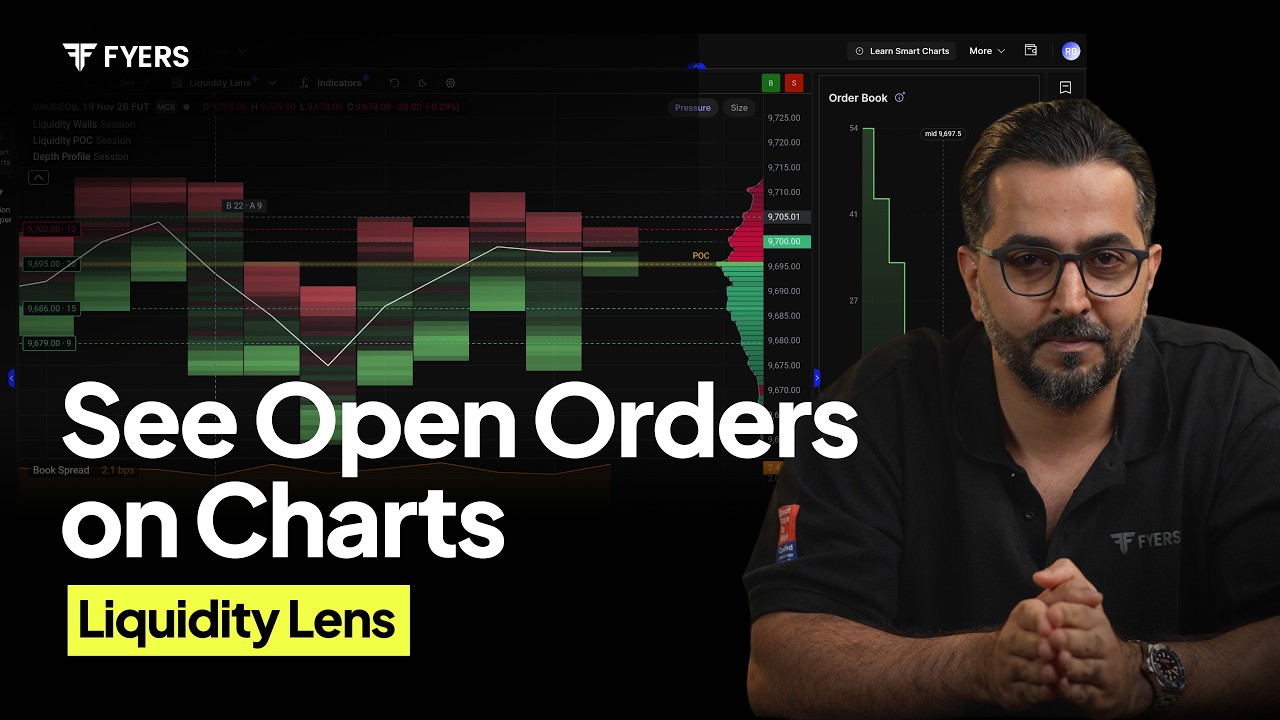
We’ve introduced Liquidity Lens on FYERS Smart Charts, a new chart type that helps you see buy and sell orders waiting to be executed in the market. While Candlestick charts show price movement and Order Flow shows executed trades, Liquidity Lens helps you understand where liquidity is currently positioned.
You can see where resting buy and sell orders are concentrated across price levels and how these concentrations change as the market moves. We’ve also added an Order Book that shows cumulative buy and sell quantities, along with Best Bid, Best Ask, and Mid Price.
To help you analyse liquidity further, we’ve introduced five indicators:
-
Depth Profile: See how resting liquidity is distributed across price levels.
-
Liquidity POC: Identify the price level with the highest concentration of resting liquidity in the visible chart range.
-
Liquidity Walls: Spot large resting orders that remain at specific price levels.
-
Book Spread: Track the difference between the best bid and best ask prices.
-
Book Imbalance: Understand how resting buy and sell quantities change relative to each other.
With Liquidity Lens, you can now study price movement, executed trades, and orders waiting in the market, all within FYERS Smart Charts.
Learn more about Liquidity Lens.
Understand Options Exposure With DEX and GEX
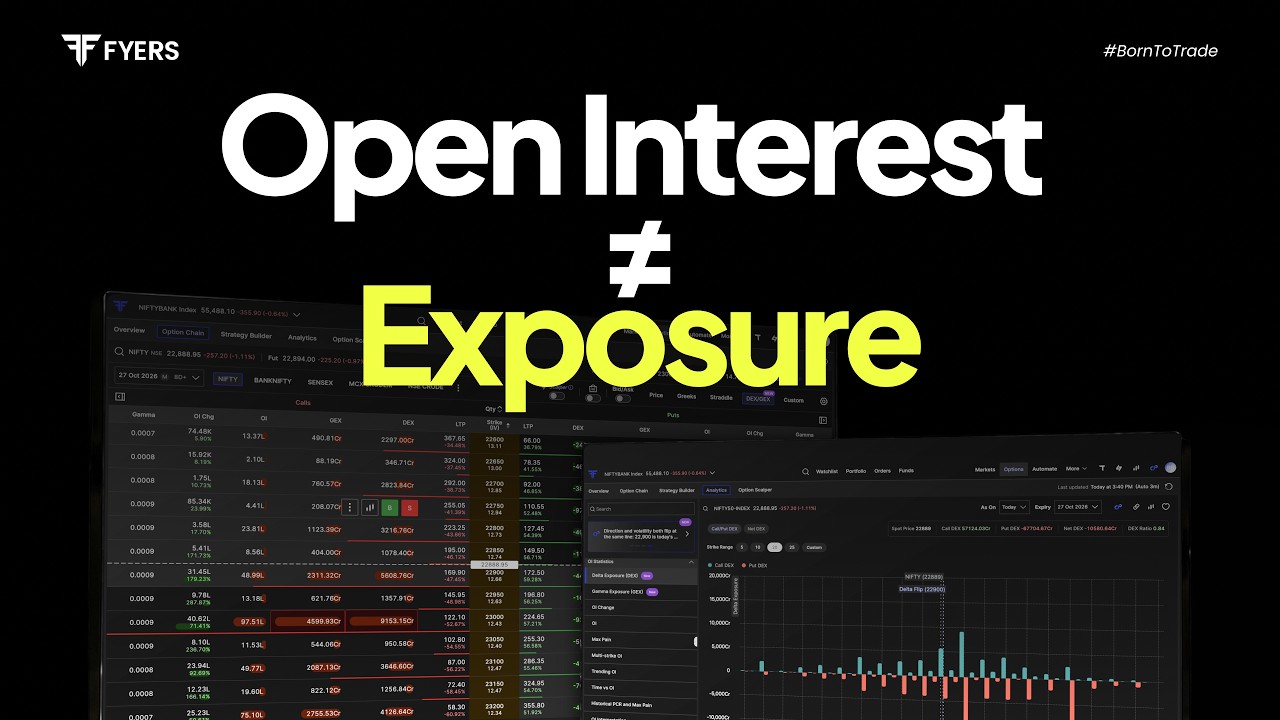
Open Interest tells you where positions are concentrated, but it doesn’t show how sensitive those positions are to changes in the underlying price. We’ve introduced Delta Exposure (DEX) and Gamma Exposure (GEX) in the FYERS Option Chain and Options Analytics to give you another perspective. You can now view DEX and GEX at individual strikes, compare Call, Put, and Net exposure across strikes, and track Delta Flip and Gamma Flip levels to understand where exposure conditions may be changing.
We’ve also added a Strike Label metric to give you more control over the information displayed for each strike. These metrics help you look beyond OI when analysing options positioning. Read more about DEX and GEX.
Compare Implied Volatility Across Strikes With IV Skew
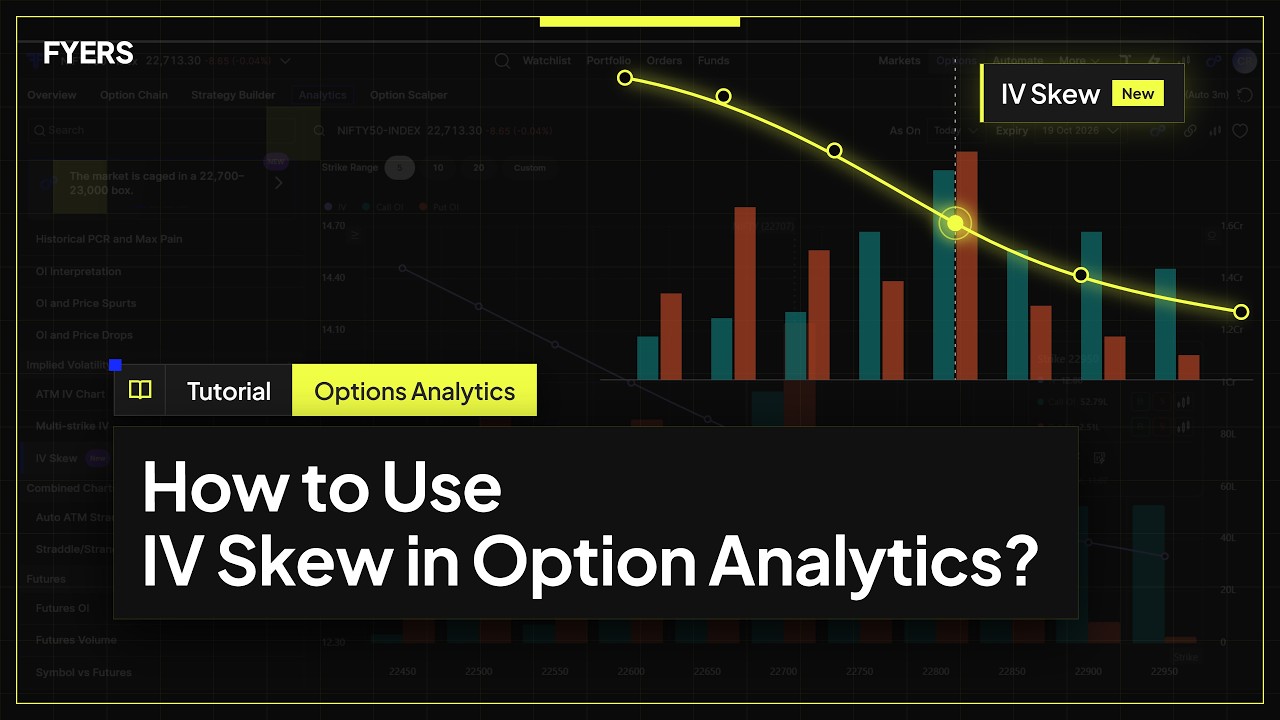
We’ve added IV Skew to Option Analytics to help you understand how Implied Volatility differs across option strikes. Instead of checking IV one strike at a time, you can now see the full IV curve and compare it alongside Call and Put Open Interest. For example, if one NIFTY option strike has an IV of 19% while another has 16%, the chart makes that difference easier to spot and interpret.
You can also use FIA Insights to understand the IV patterns and how volatility is being priced across strikes. Explore IV Skew.
Switch Between Symbols Faster on Mobile Charts
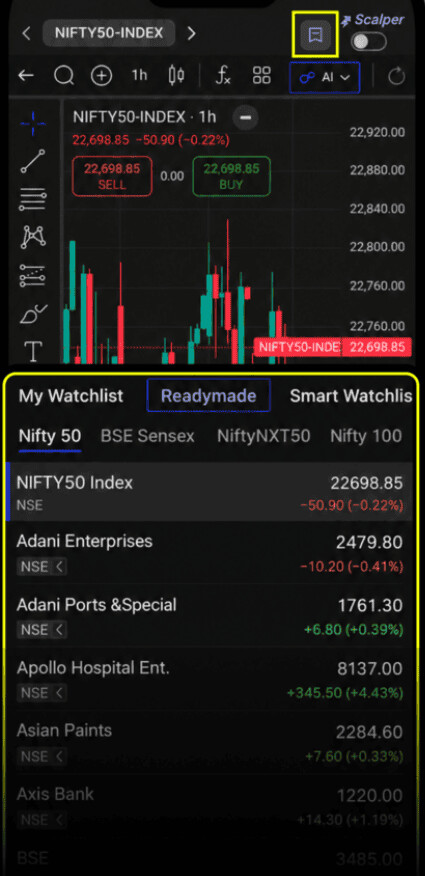
We’ve introduced Watchlist Mode on charts in the App to make it easier to analyse multiple instruments without repeatedly returning to your watchlist. You can select an existing watchlist directly from the top of the chart and use the left and right arrows to move between its symbols.
If you’re tracking 15 stocks during the trading session, you can now move through their charts one after another without opening each stock separately. Learn how to use Watchlist Mode.
Trade Options With TradeFlow
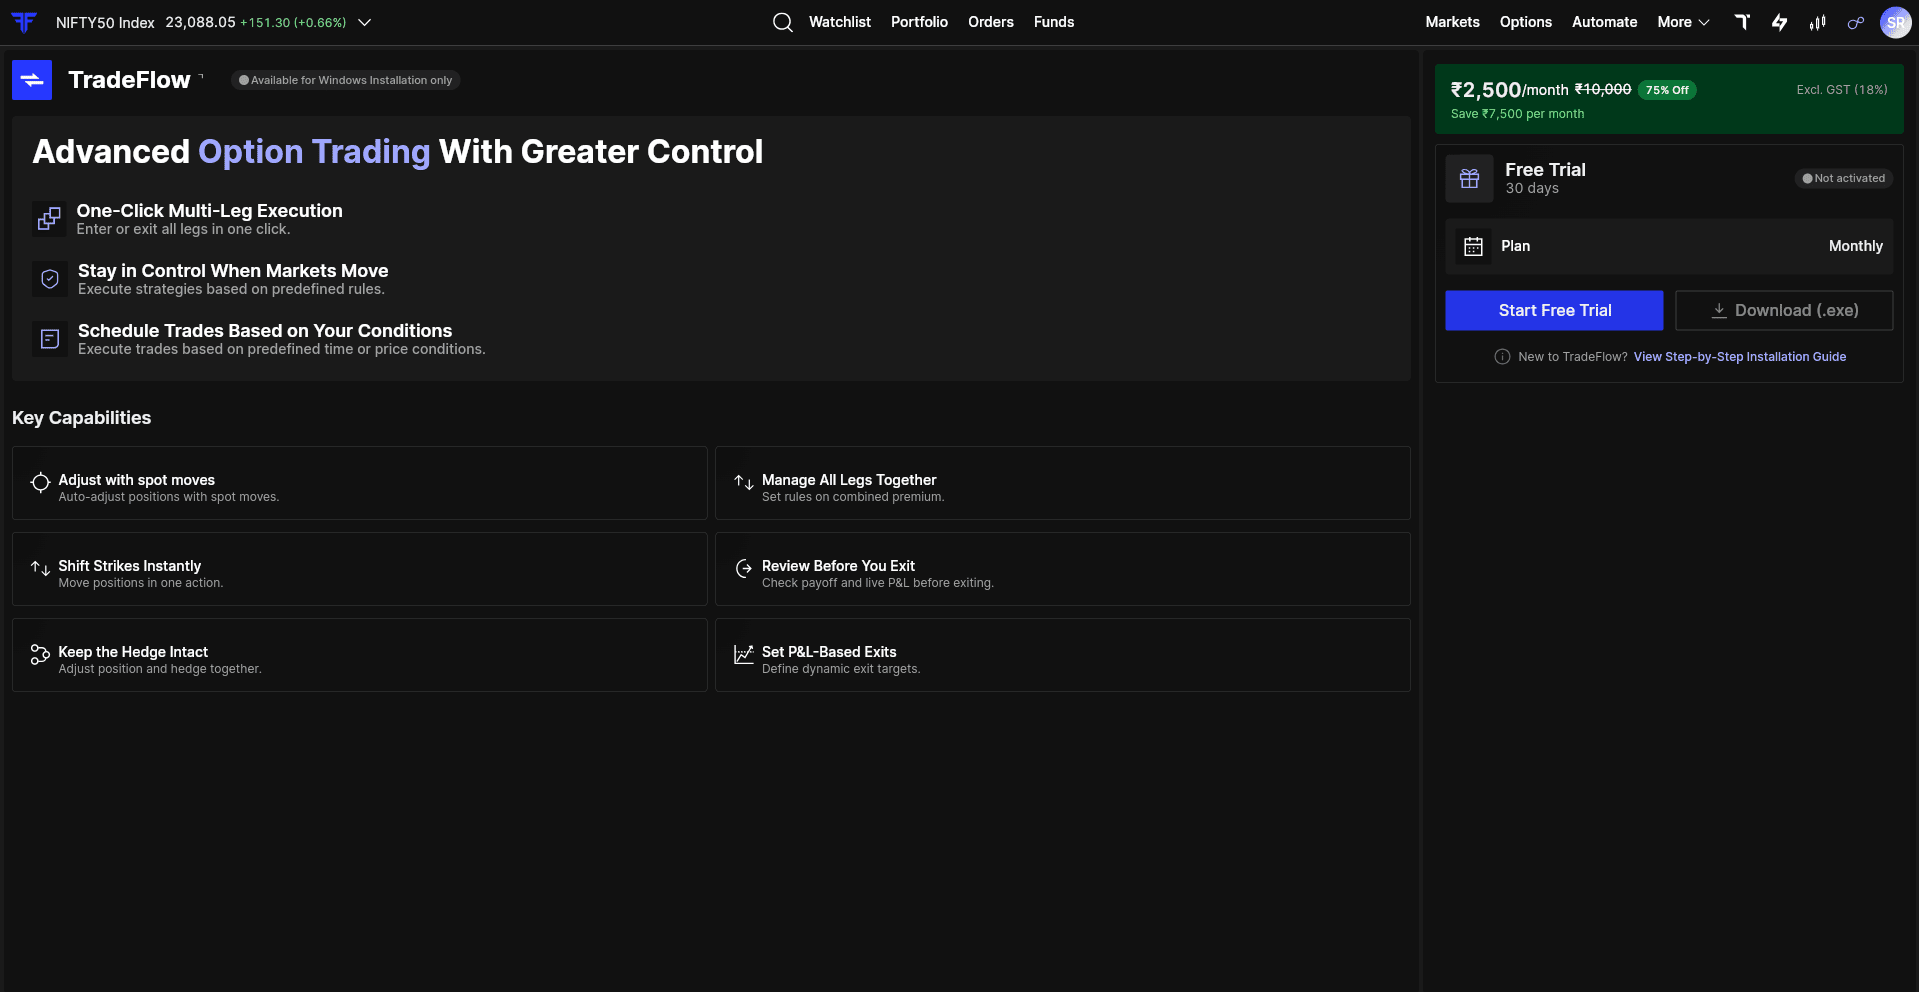
We’ve integrated TradeFlow with FYERS, giving options traders another way to execute and manage multi-leg strategies. You can use the TradeFlow desktop application to execute Straddles, Strangles, and custom multi-leg strategies with a single click. It also supports timed entries and exits, hedge management, and risk controls through semi-automated execution.
TradeFlow connects through the FYERS API, without requiring static IP configuration. Learn how to connect TradeFlow.
Get a Complete Picture of Your Investments With Wealth View
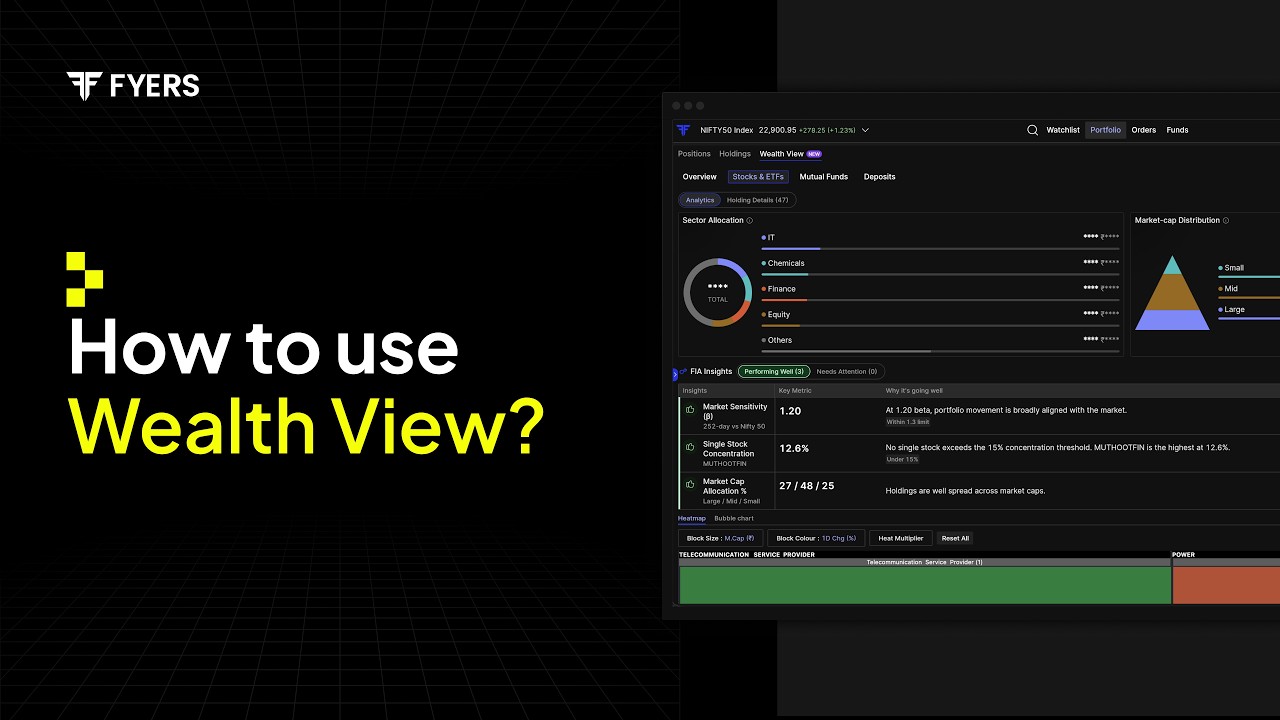
Your investments may be spread across different brokers and platforms, making it difficult to see how your overall portfolio is performing. We’ve introduced Wealth View to bring your stocks, ETFs, mutual funds, and deposits together in one place, even when they’re held outside FYERS.
You can review your overall portfolio performance, asset allocation, and concentration across investments. We’ve also added FIA Insights to help you understand portfolio composition and potential risks. Connect your accounts and refresh the data whenever you need an updated view of your investments. Learn more about Wealth View.
Four New Indicators on FYERS Charts
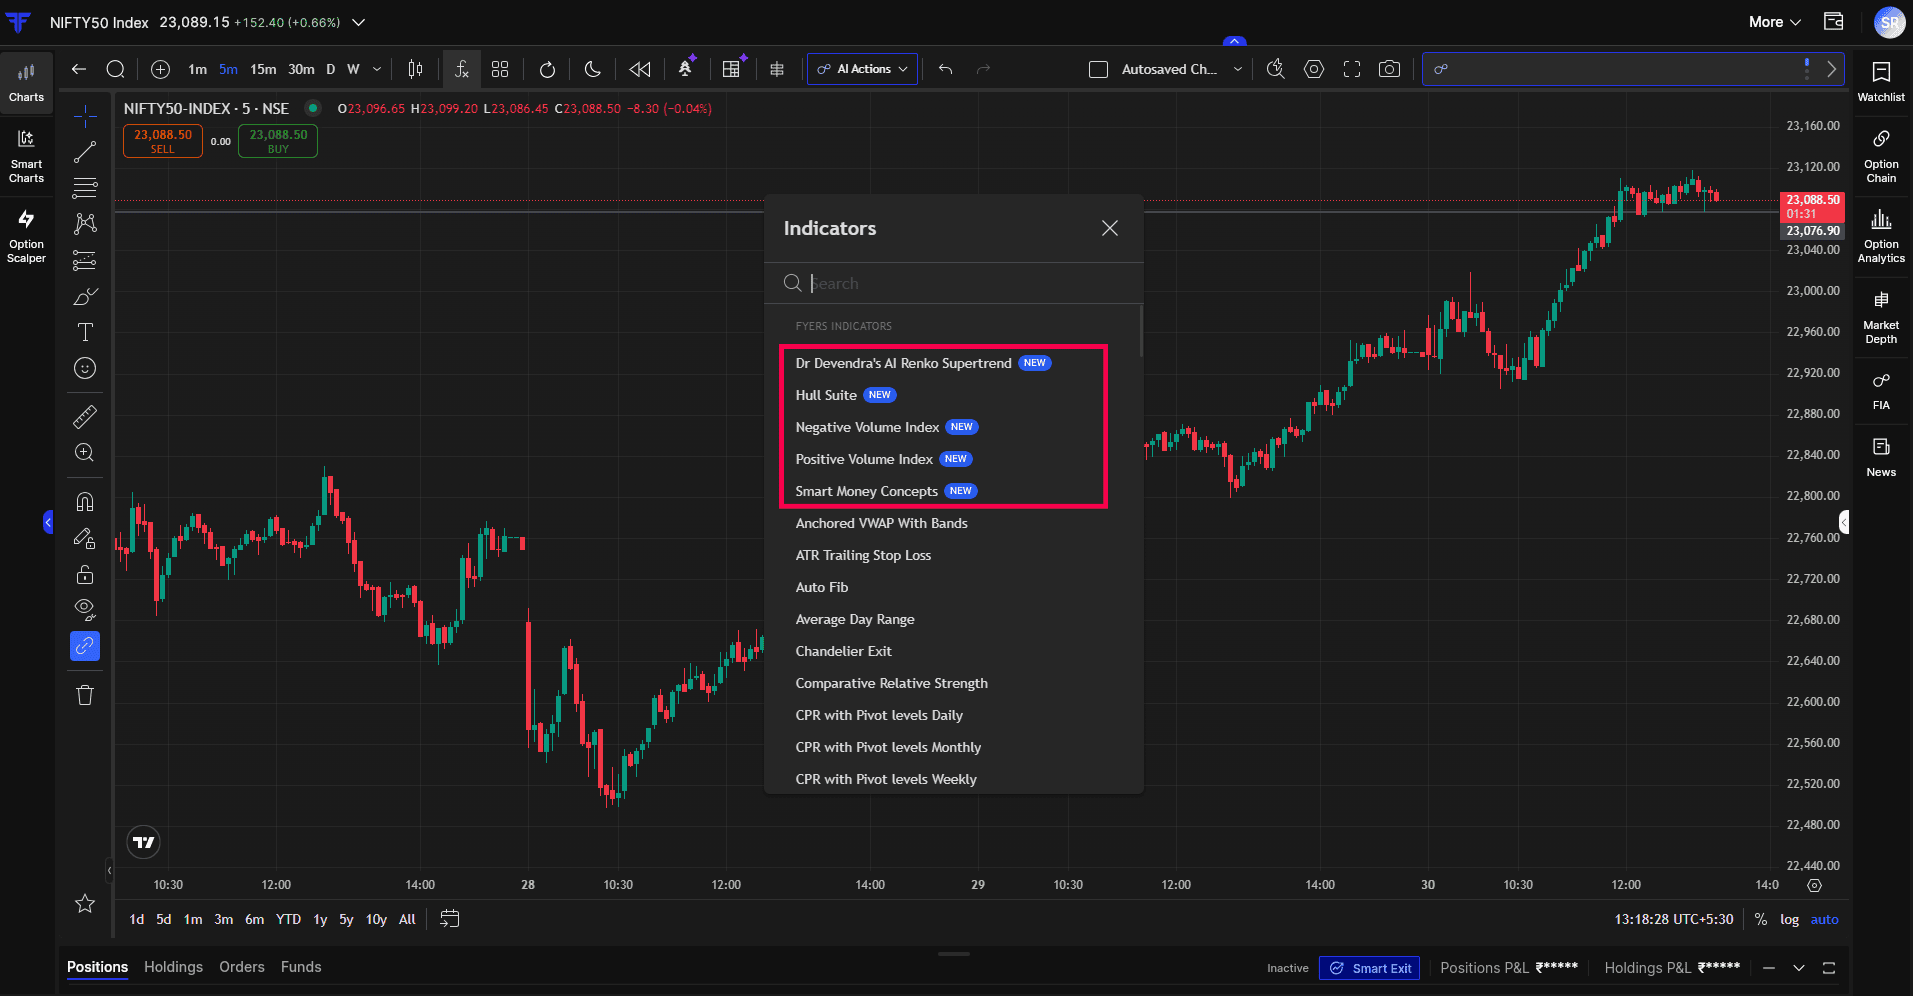
We’ve also added four indicators to Charts, covering market structure, trend, and volume analysis. Smart Money Concepts (SMC) helps you study market structure and identify important price zones. Hull Suite provides another way to follow trend direction.
We’ve also added Negative Volume Index (NVI) and Positive Volume Index (PVI) to help you study price movements in relation to changes in trading volume. All four are now available in the indicators library on FYERS Charts. Read more about the indicators.
Analyse Mutual Funds and SIFs in Greater Detail
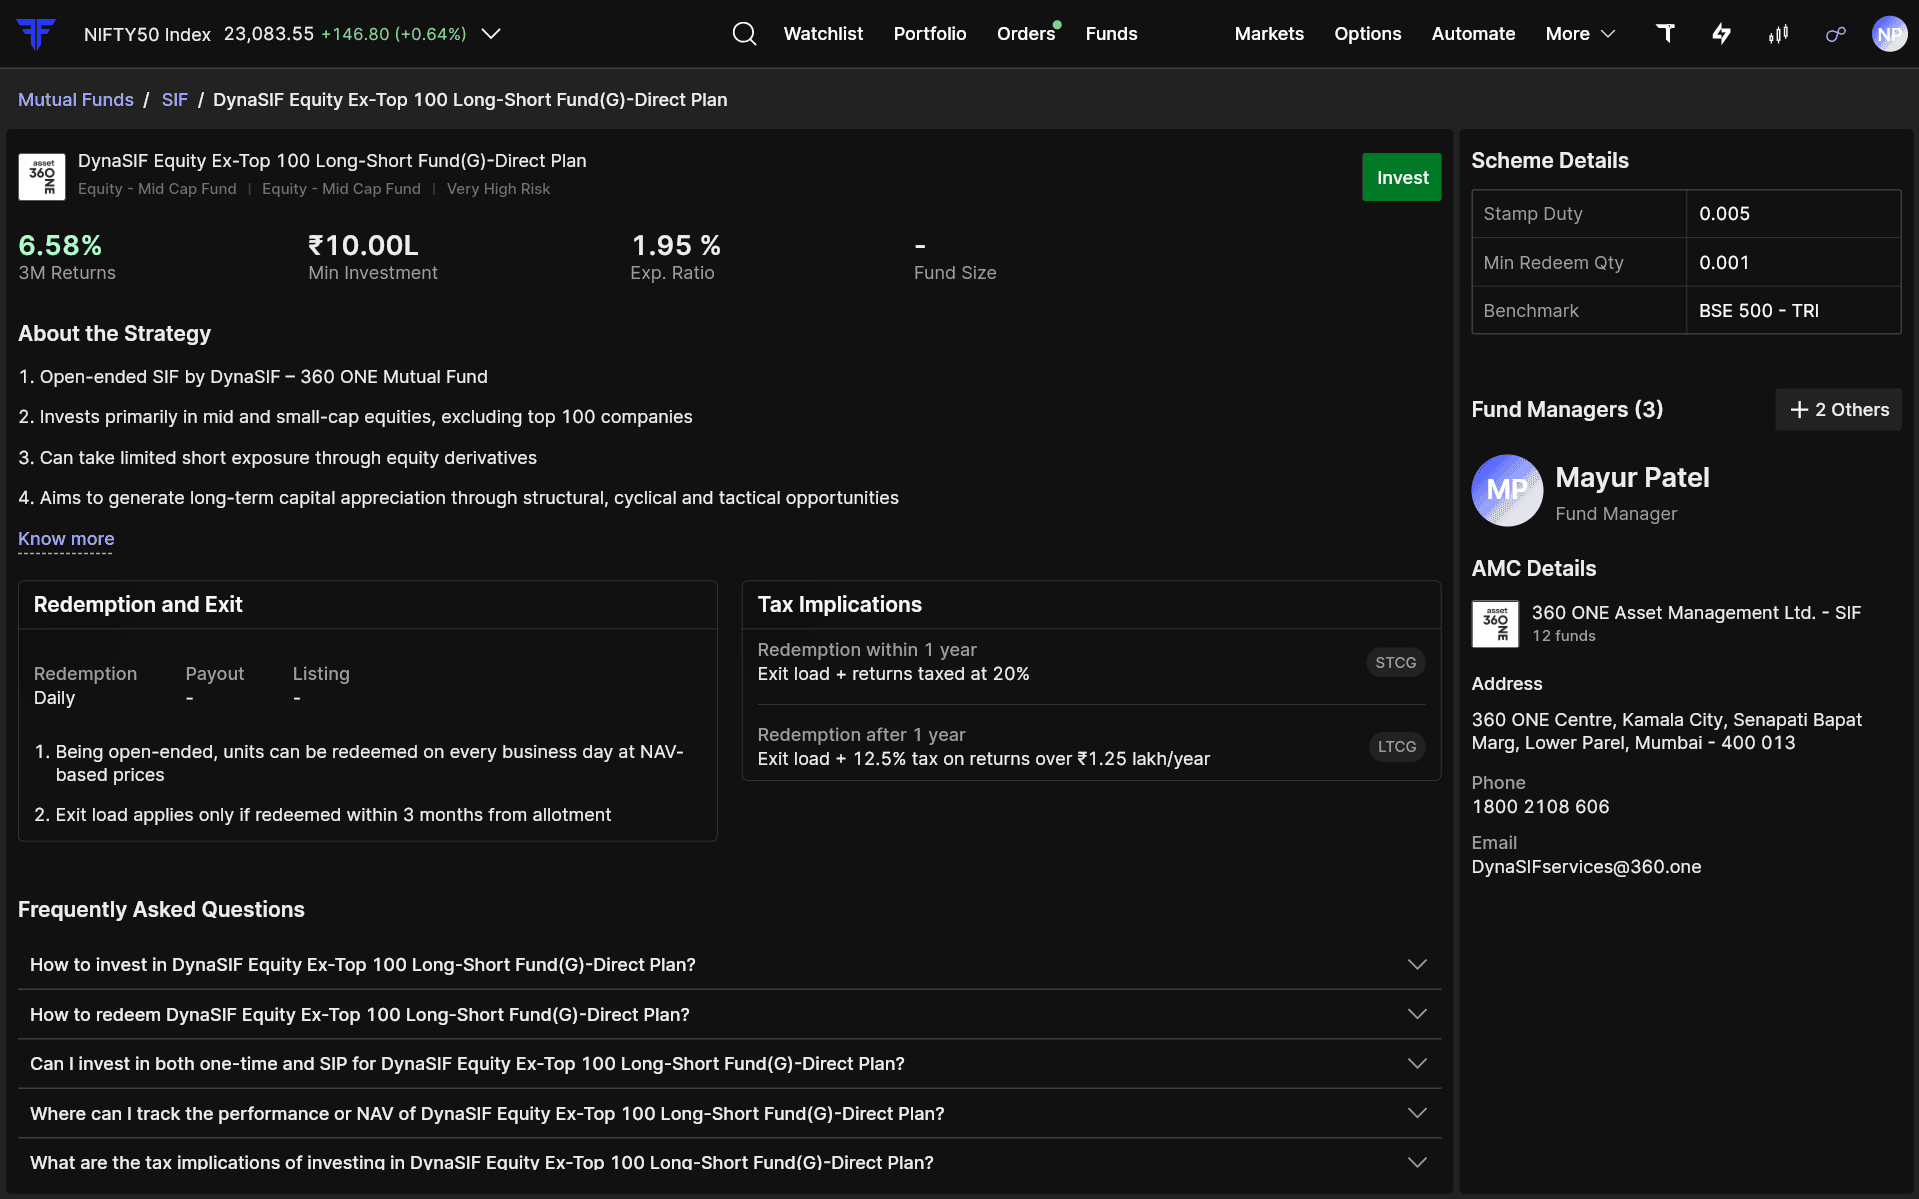
We’ve enhanced Scheme Details to help you understand what’s happening inside a Mutual Fund or Specialised Investment Fund (SIF) before making an investment decision. For Mutual Funds, you can now explore asset allocation, market cap exposure, top holdings, and sector allocation. You can also track month-on-month portfolio changes, including stocks where exposure has increased or decreased, new additions, and complete exits.
For example, if a fund increased its banking allocation from 20% to 25% over a month, you can see that change and explore the underlying holdings instead of relying only on past returns. We’ve also added comparisons of fund returns and category rankings across different timeframes, along with fund manager details, AUM managed, and other schemes they oversee.
For SIFs, Scheme Details now provides a clearer view of the investment strategy, key metrics, minimum investment requirements, redemption conditions, payout timelines, taxation, and fund management information. The idea is to give you more of the information you need to evaluate a scheme in one place. Learn more about Mutual Fund analysis & SIF analysis.
Compare Market Data Faster With Table View
Heatmaps and Bubble Charts are useful for spotting patterns visually. But when you want to compare actual numbers across several instruments, a table can be more practical. We’ve introduced Table View across Sector Heatmaps, Indices Heatmaps, Bubble Charts, and My Screeners.
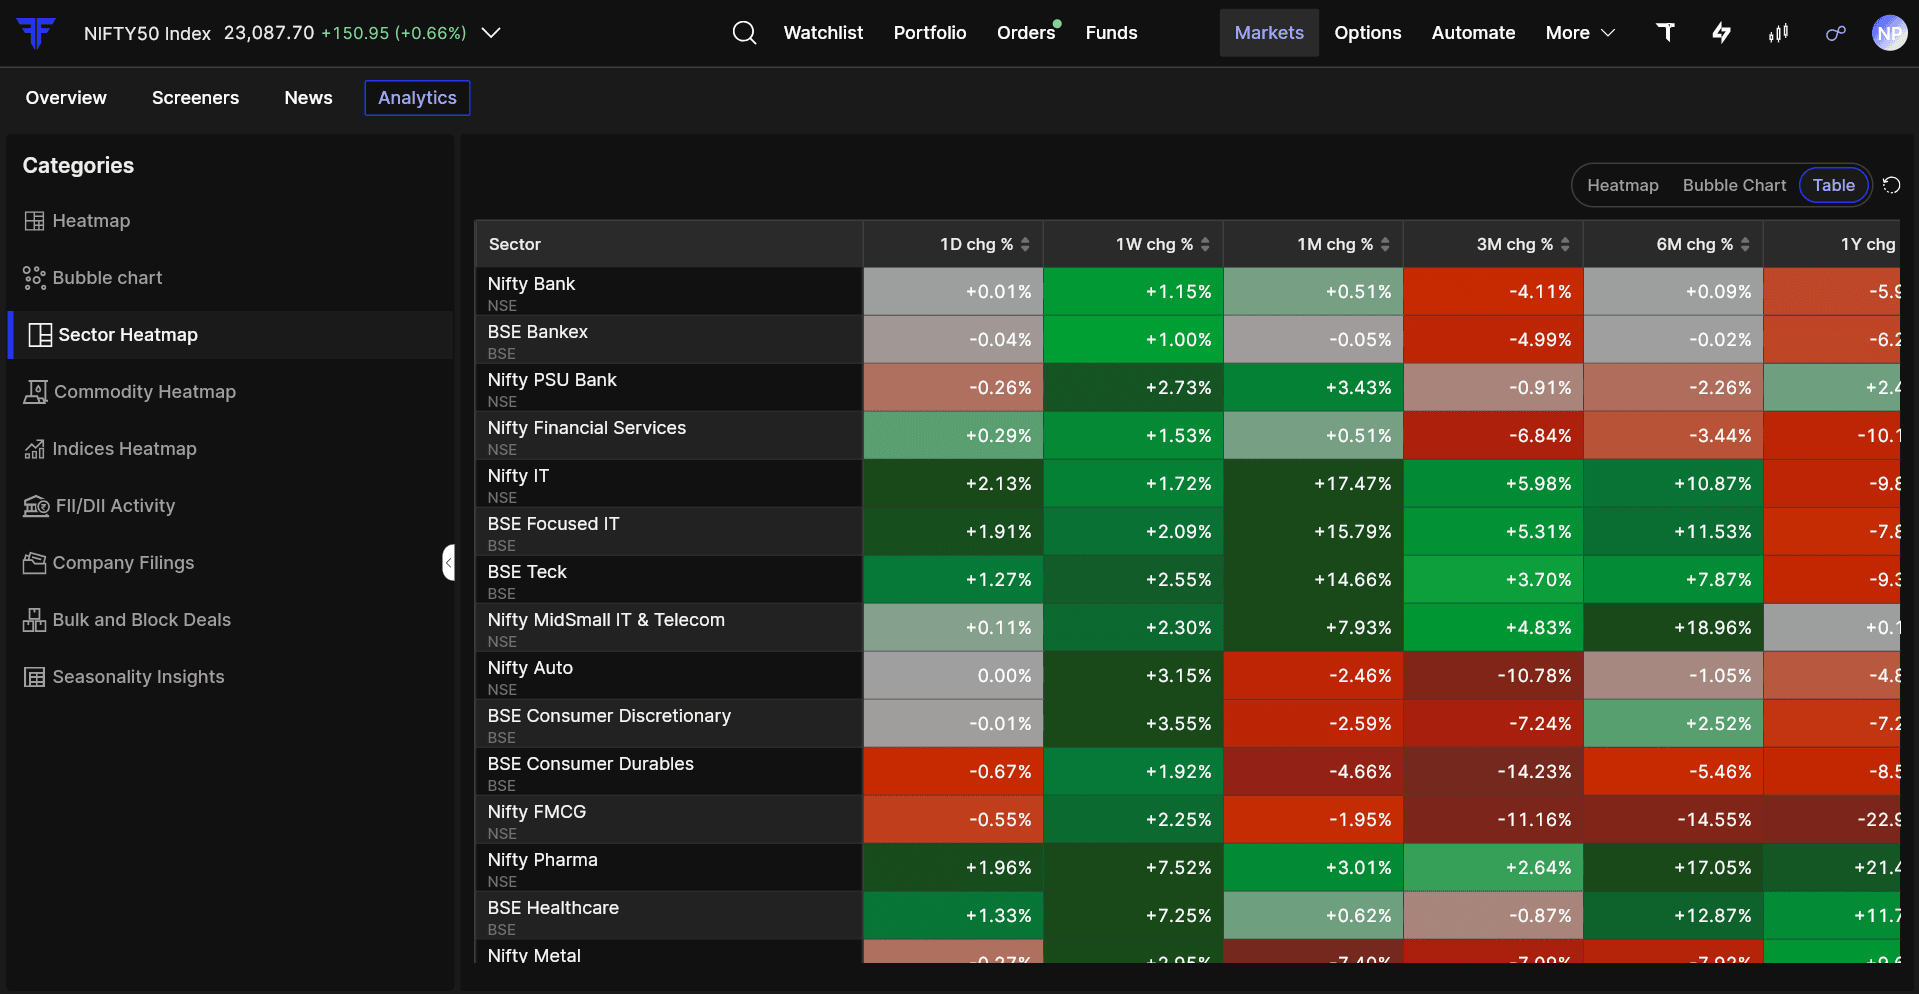
In Heatmaps, you can now compare index and sector returns across different timeframes, sort by performance, and explore constituent stocks within the same table. For example, a sector might be up 2% over the past week but down 10% over six months. Table View makes it easier to compare short-term performance with the broader trend.
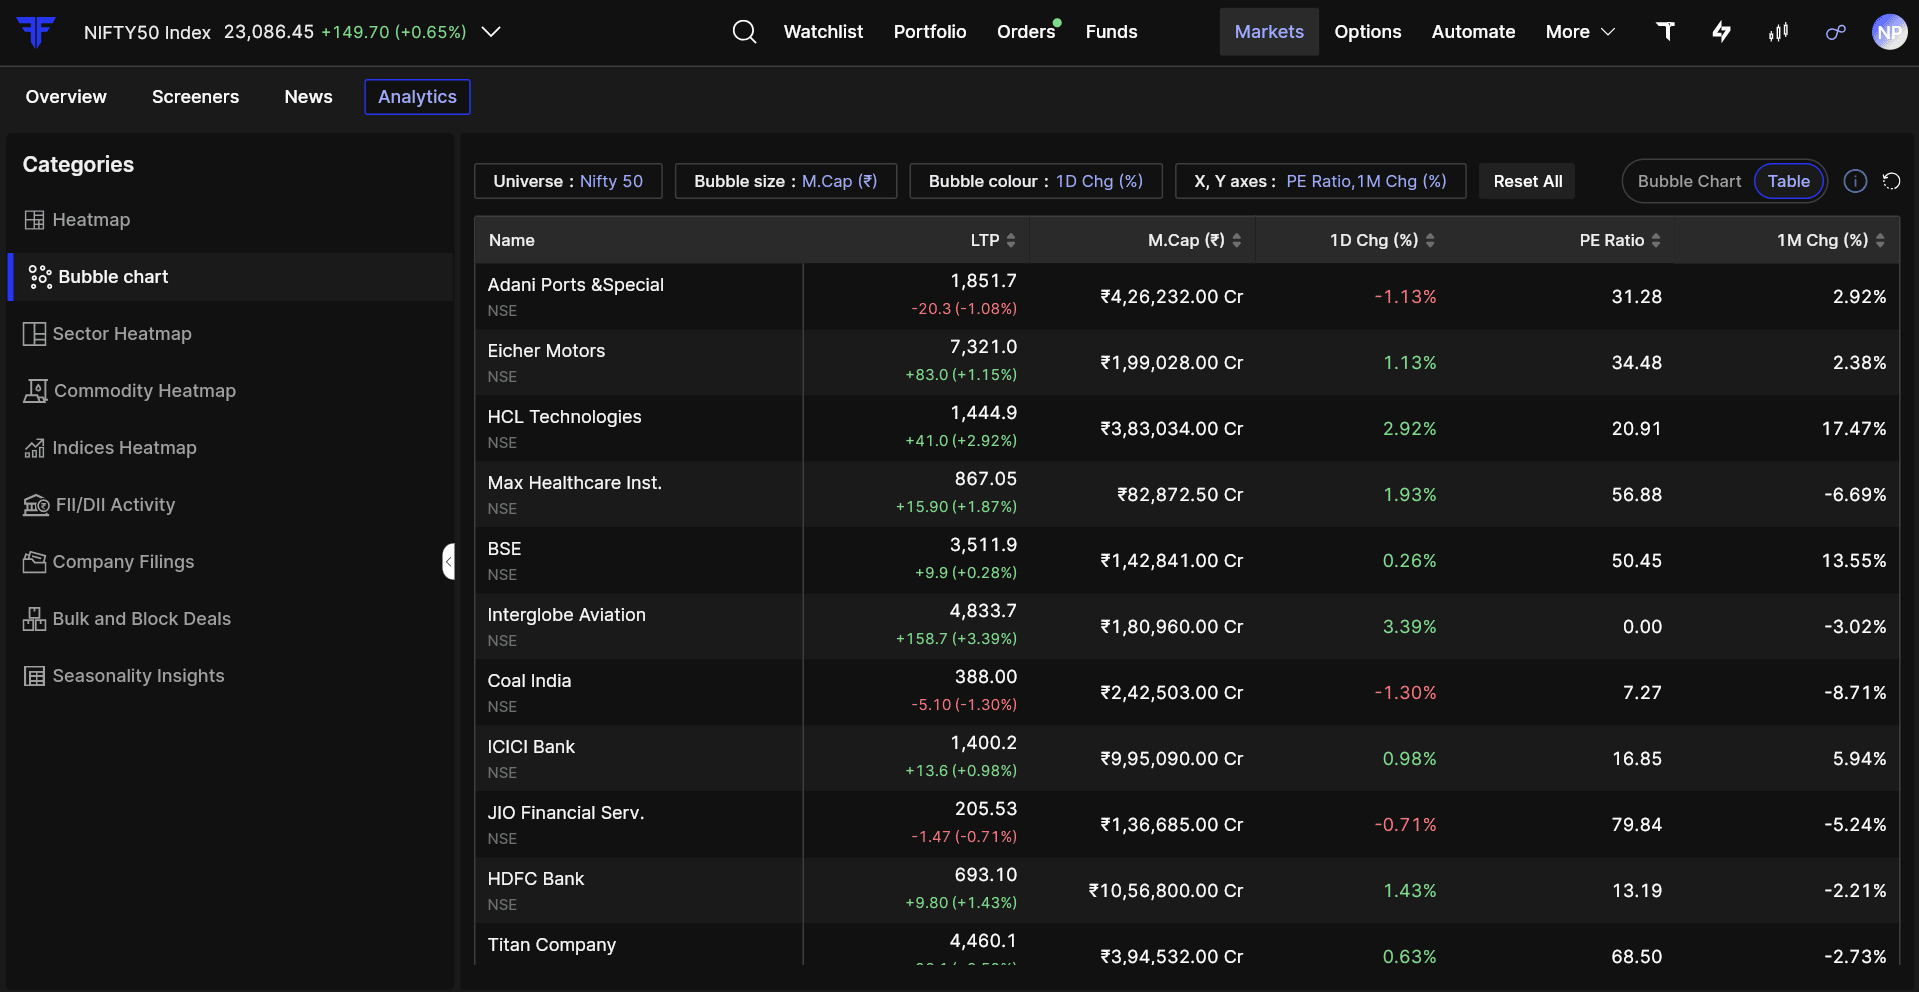
In Bubble Charts, you can compare stocks using the same four metrics selected for bubble size, colour, and the two axes. You can sort the values to identify stocks that match what you’re looking for. We’ve also added Table View to My Screeners, so you can review, sort, and manage your saved screeners with their key details in one place.
Explore Strategic Indices in Heatmaps
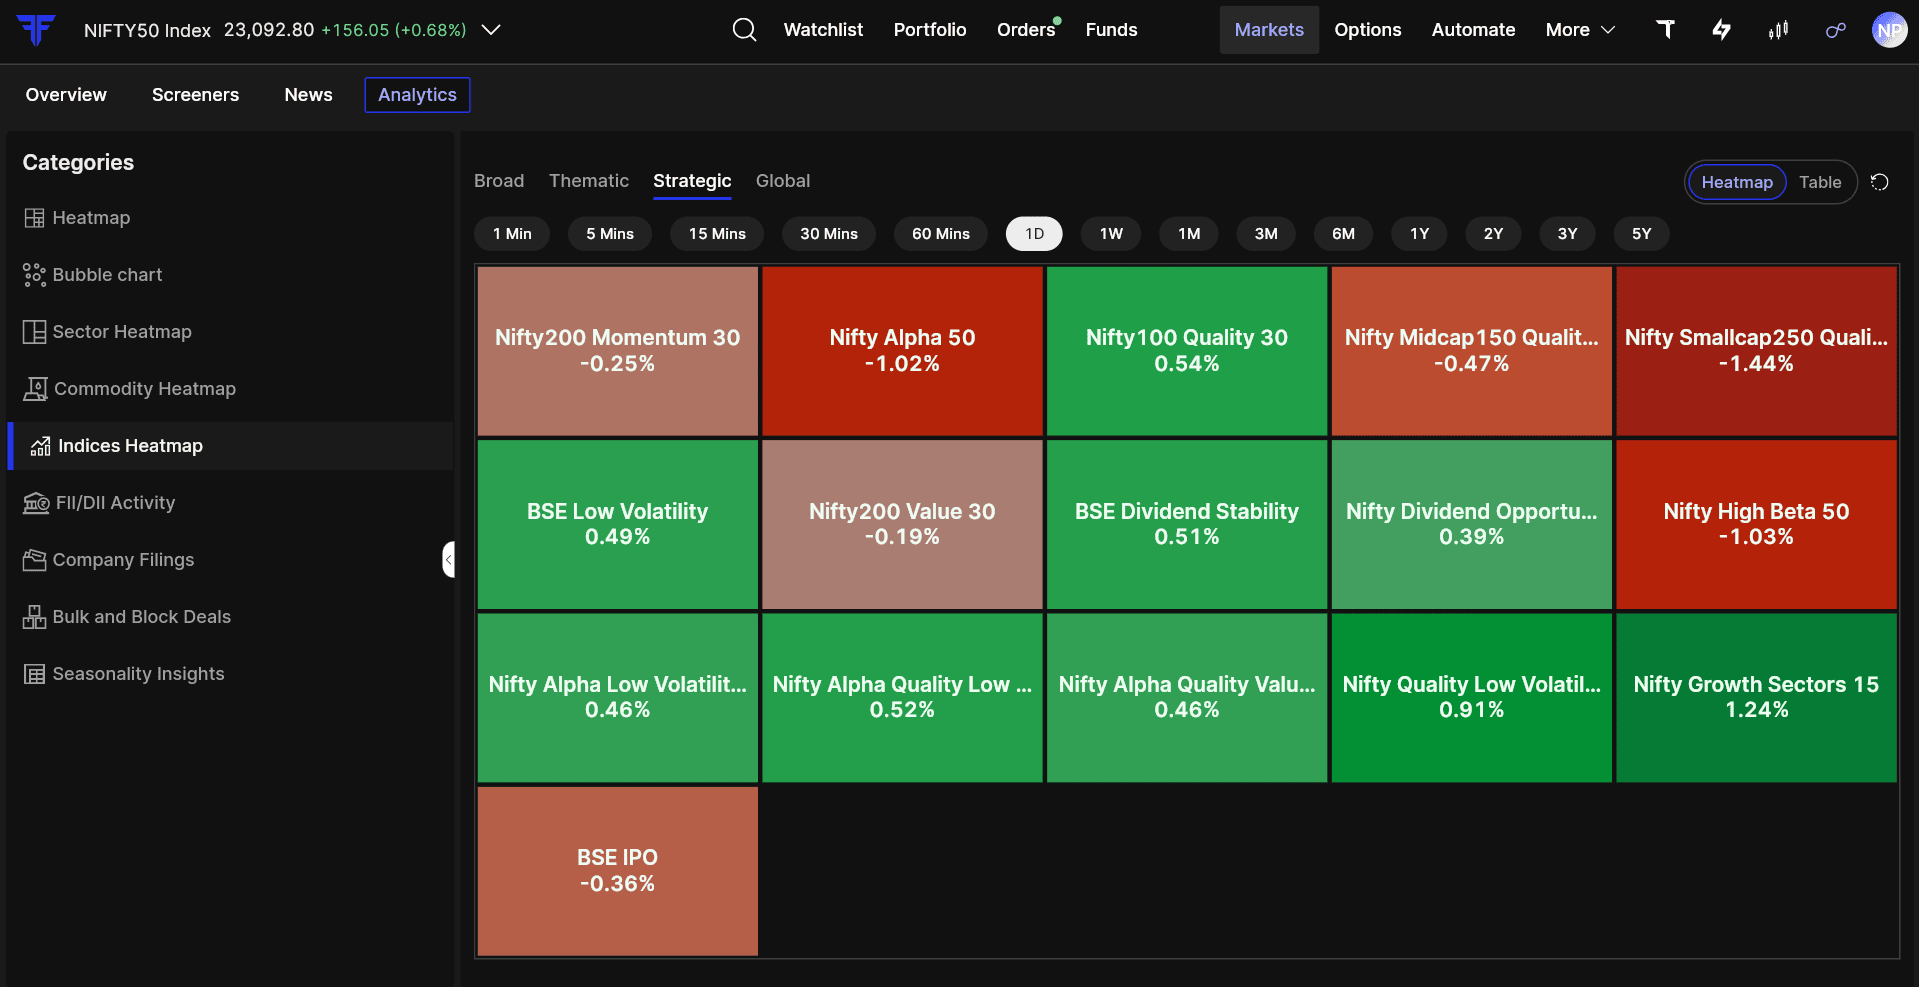
We’ve expanded Heatmaps to include Strategic Indices based on factors such as momentum, quality, value, and low volatility. You can use Heatmap View to see how these indices are performing visually or switch to Table View to compare their returns across different timeframes.
This gives you another way to study market performance beyond traditional broad and sectoral indices.
More API Capabilities With FYERS Prime
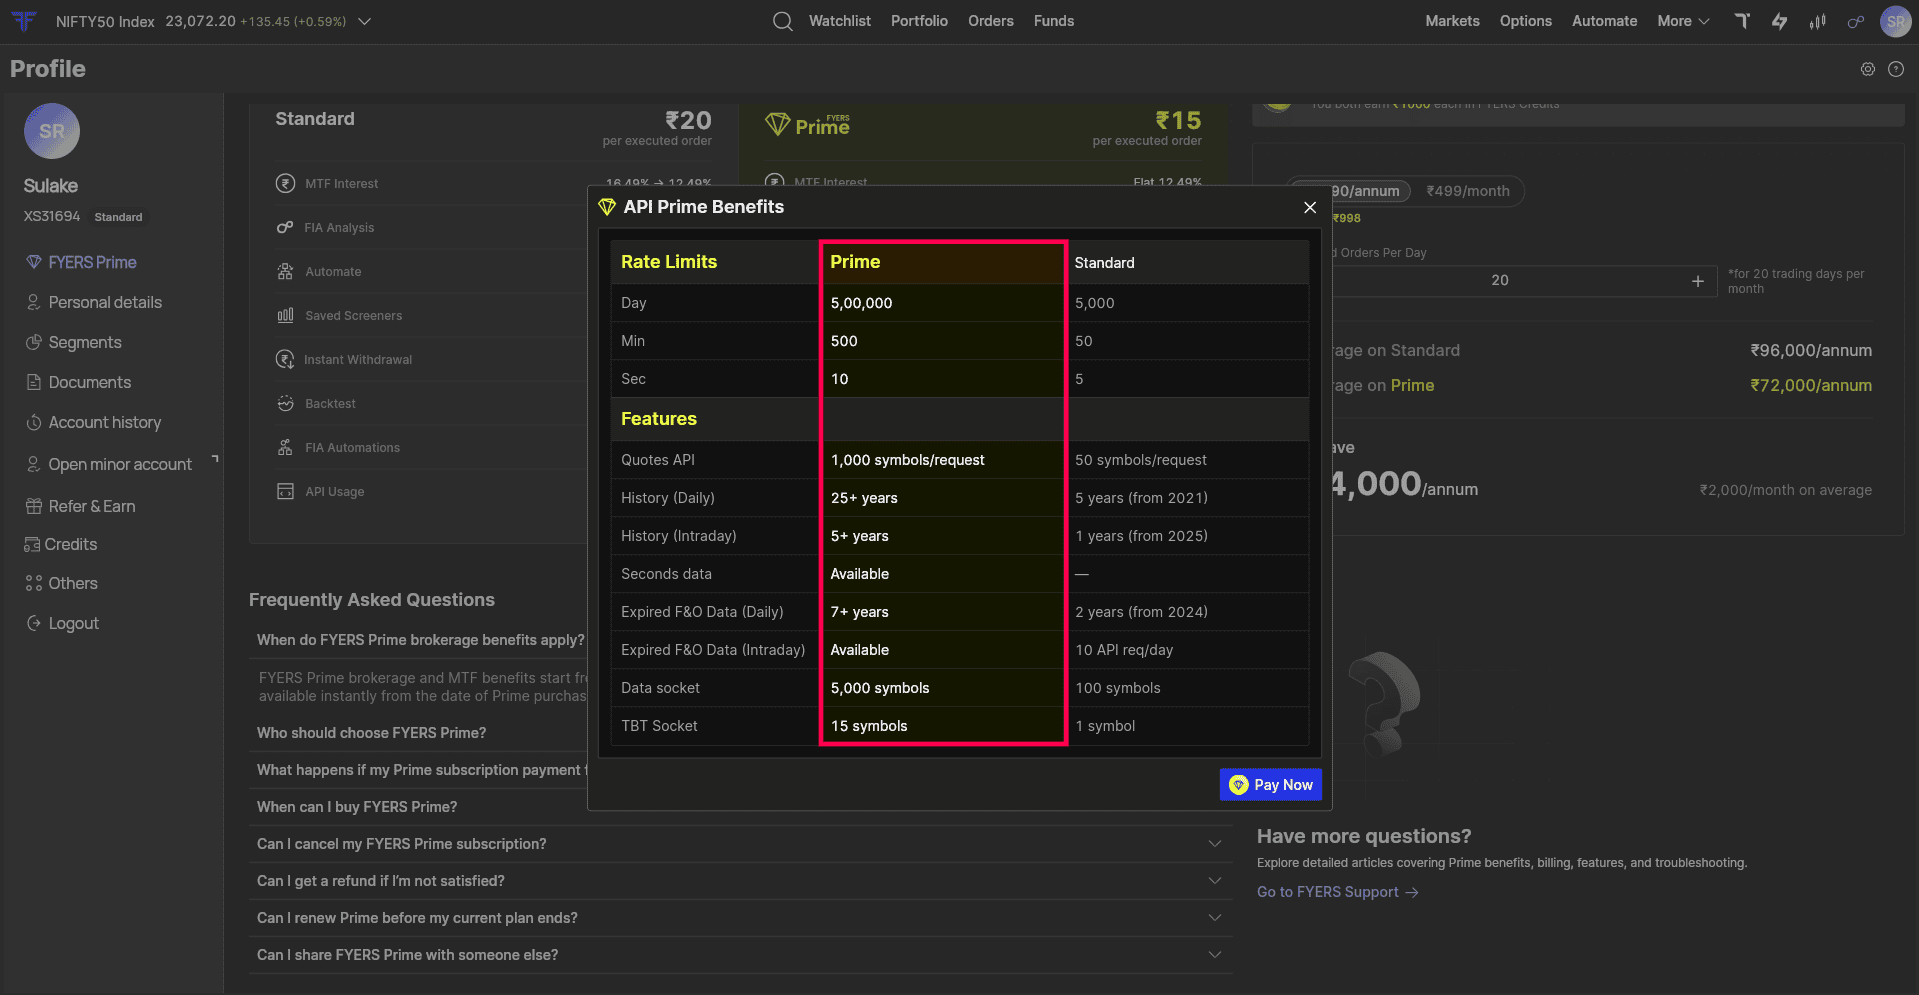
We’ve expanded the API benefits available with FYERS Prime, giving developers and API traders access to higher limits and more historical market data.
With FYERS Prime, you can now access:
-
Up to 5,00,000 Data API requests per day.
-
20+ years of daily data, 5+ years of intraday data, and seconds-level data.
-
7+ years of expired F&O data and historical option Greeks.
-
Quotes for up to 1,000 symbols per API request.
-
Up to 5,000 Data WebSocket symbols and 15 TBT WebSocket symbols.
These expanded limits are useful if you’re building trading systems, running historical analysis, or tracking larger sets of market instruments through APIs.
Explore the FYERS API Documentation or compare API limits.
October Webinars
We continued our webinars through October with sessions covering options trading, AI-assisted strategy building, Smart Money Concepts, trading APIs, commodity derivatives, and market screeners. If you missed them live, catch up on the recordings here:
Explore more upcoming and past sessions on the FYERS Webinars page.
October Events
October was another active month on the ground, with FYERS participating in trading and commodities events across Bengaluru, Kerala, and Hyderabad.
-
BOTS Traders Conclave (Residential), Bengaluru | 2 to 4 October
-
MCX Commodity Forum, Kerala | 17 October
-
Traders Connect, Kerala | 21 October
-
Partners Event, Hyderabad | 26 October
You can find upcoming events and past event galleries on the FYERS Events page.
That wraps up October. From deeper options analytics and custom indicators to faster trading workflows and better investment insights, we’ve made several additions to how you trade and invest on FYERS. We’ll continue improving these tools and building new ones based on how you use them. As always, keep sharing your feedback. It helps us decide what to work on next.
Order Latency | October 2026
Web and App: 4.98 ms at p99
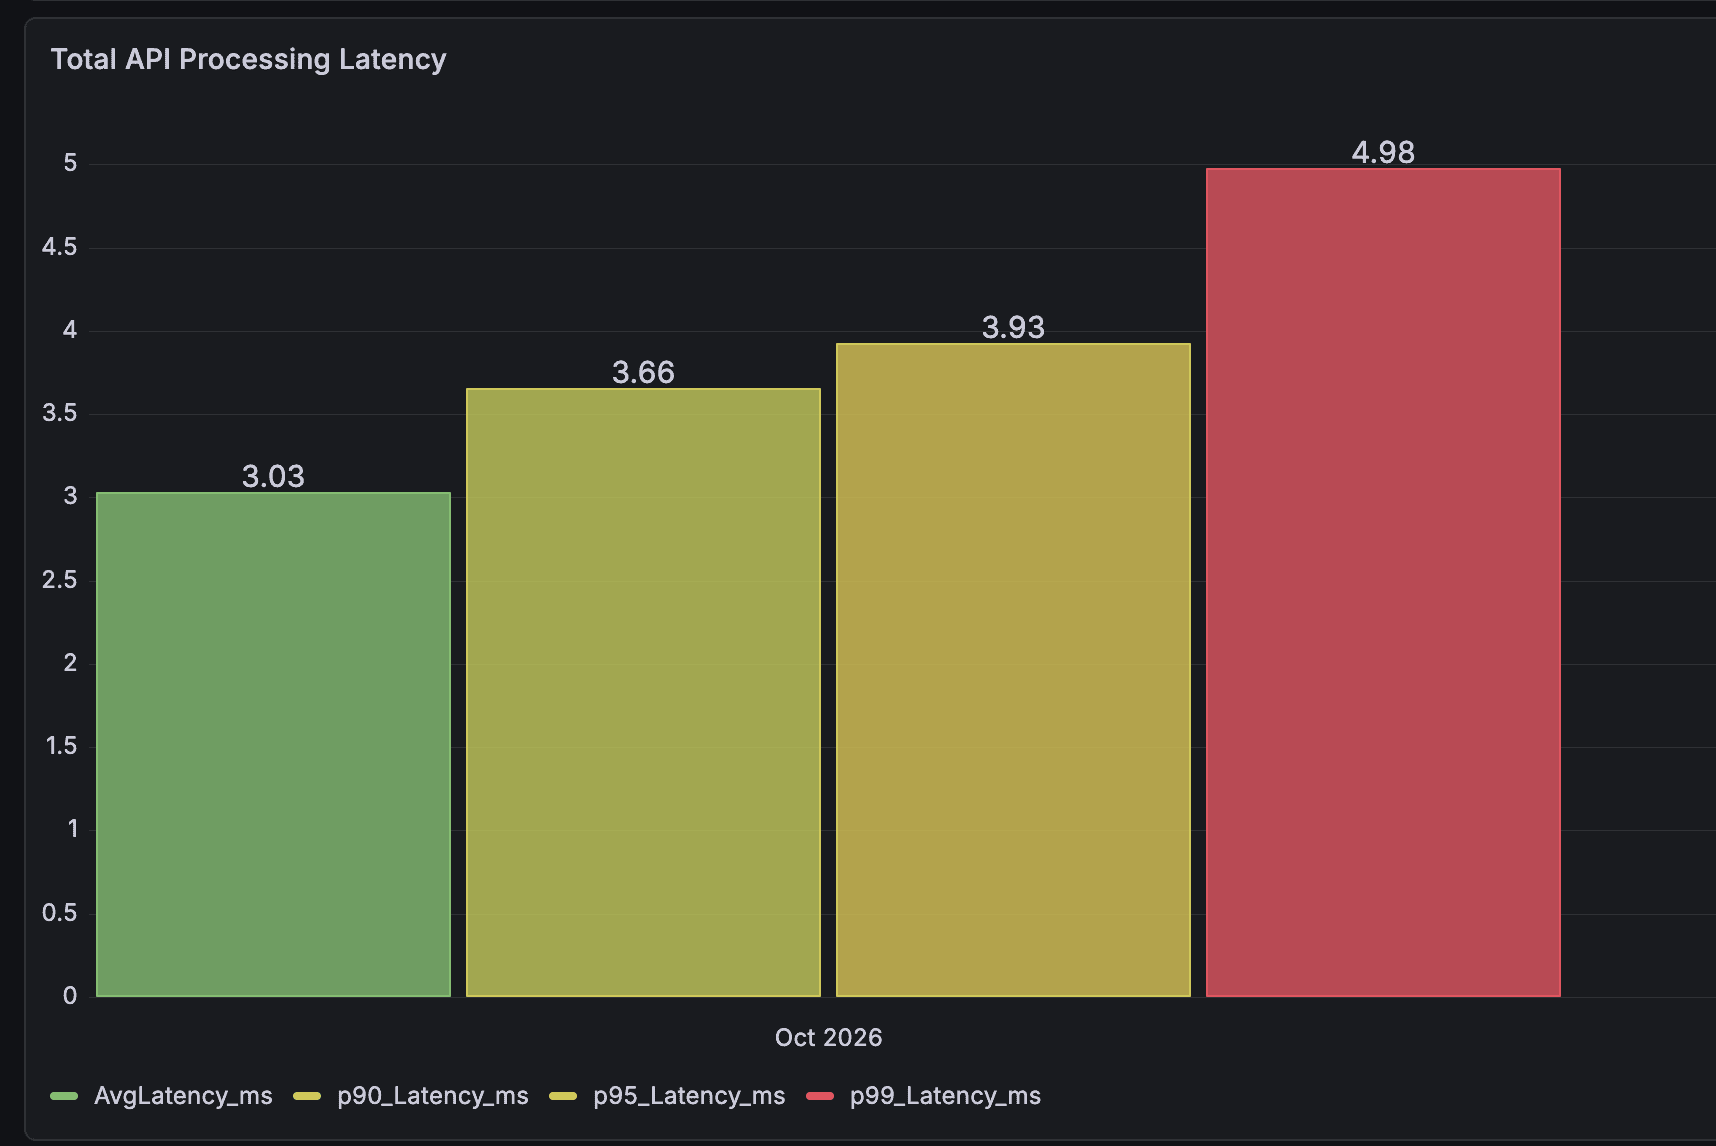
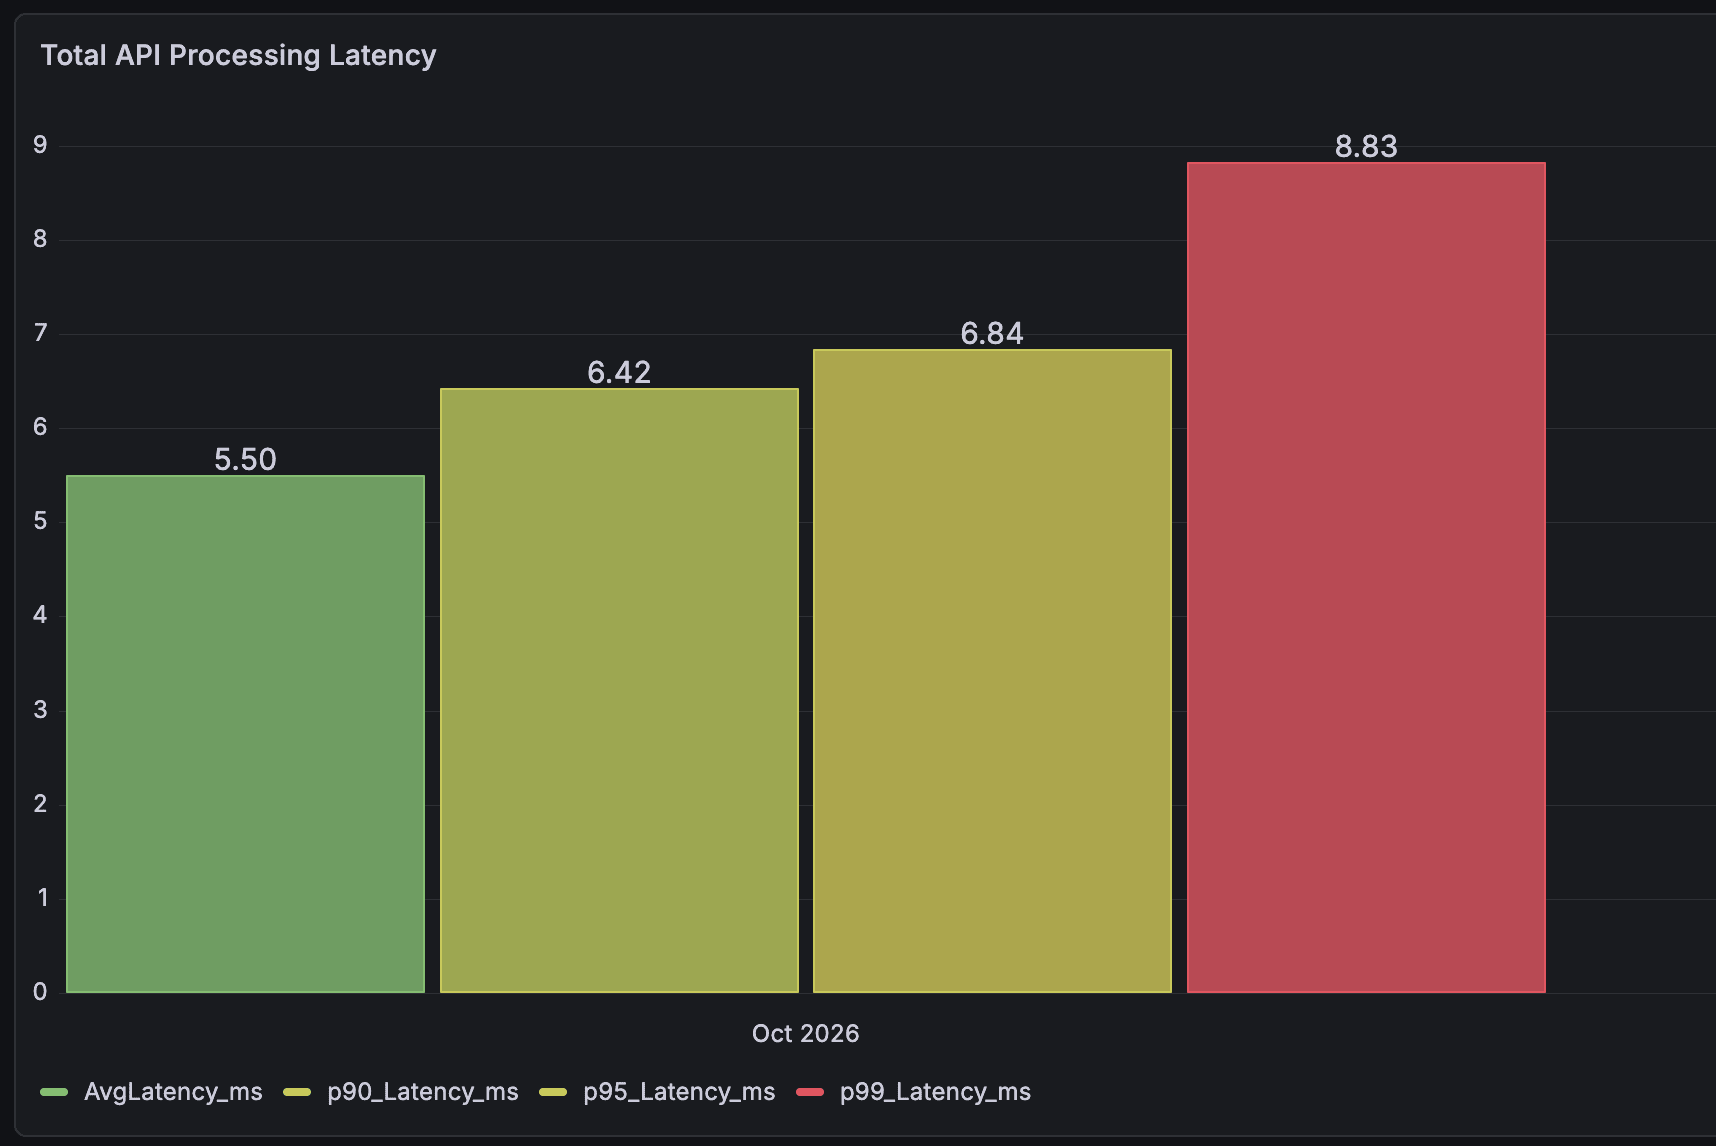
API: 8.83 ms at p99