If you trade options, Open Interest is probably one of the first things you check. It shows where traders have built positions and which strikes have more activity.
But OI does not tell you how strongly those positions can react when the market moves.
Two strikes can have similar OI, but they may respond differently to market movements because their Delta and Gamma values are different. This is where Delta Exposure (DEX) and Gamma Exposure (GEX) help.
We have now added both to FYERS. You can view them directly in the Option Chain and understand the broader picture through Options Analytics.
Understanding Delta and DEX
Delta tells you how much an option premium may change when the underlying moves by 1 point.
For example, if a NIFTY Call has a Delta of 0.50 and NIFTY moves up by 100 points, the option premium may increase by around 50 points, assuming other factors remain the same.
DEX takes this a step further. It combines Open Interest with Delta to show the directional exposure at each strike. In simple terms, it helps you understand how sensitive open positions are to changes in the underlying price.
This helps you understand why a strike with higher OI may not always have higher DEX.
Let’s take an example.
NIFTY is trading around 22,776. The 22,700 Call has an OI of around 47.14 lakh and a DEX of about ₹5,912 crore.
The 23,000 Call has higher OI at around 57.23 lakh, but its DEX is lower at about ₹3,262 crore.

If you look only at OI, the 23,000 Call appears to have more positions. But when you look at DEX, the 22,700 Call has higher directional exposure, even with lower OI.
Looking at DEX along with OI helps you compare strikes and see where directional exposure is higher.
That is the value of DEX. OI tells you how many positions are there. DEX tells you how much directional exposure is behind them.
Understanding Gamma and GEX
Delta can change when NIFTY moves. Gamma tells you how quickly Delta changes as NIFTY moves.
For example, two options may have similar Delta values, but the option with higher Gamma will see a bigger change in Delta for the same move in NIFTY, assuming other factors remain the same.
This is where Gamma Exposure (GEX) helps. It combines Gamma with Open Interest to show the Gamma Exposure at different strikes.
For example, the 22,800 Call has a GEX of around ₹2,378 crore. This shows the Gamma Exposure associated with the open positions at that strike.
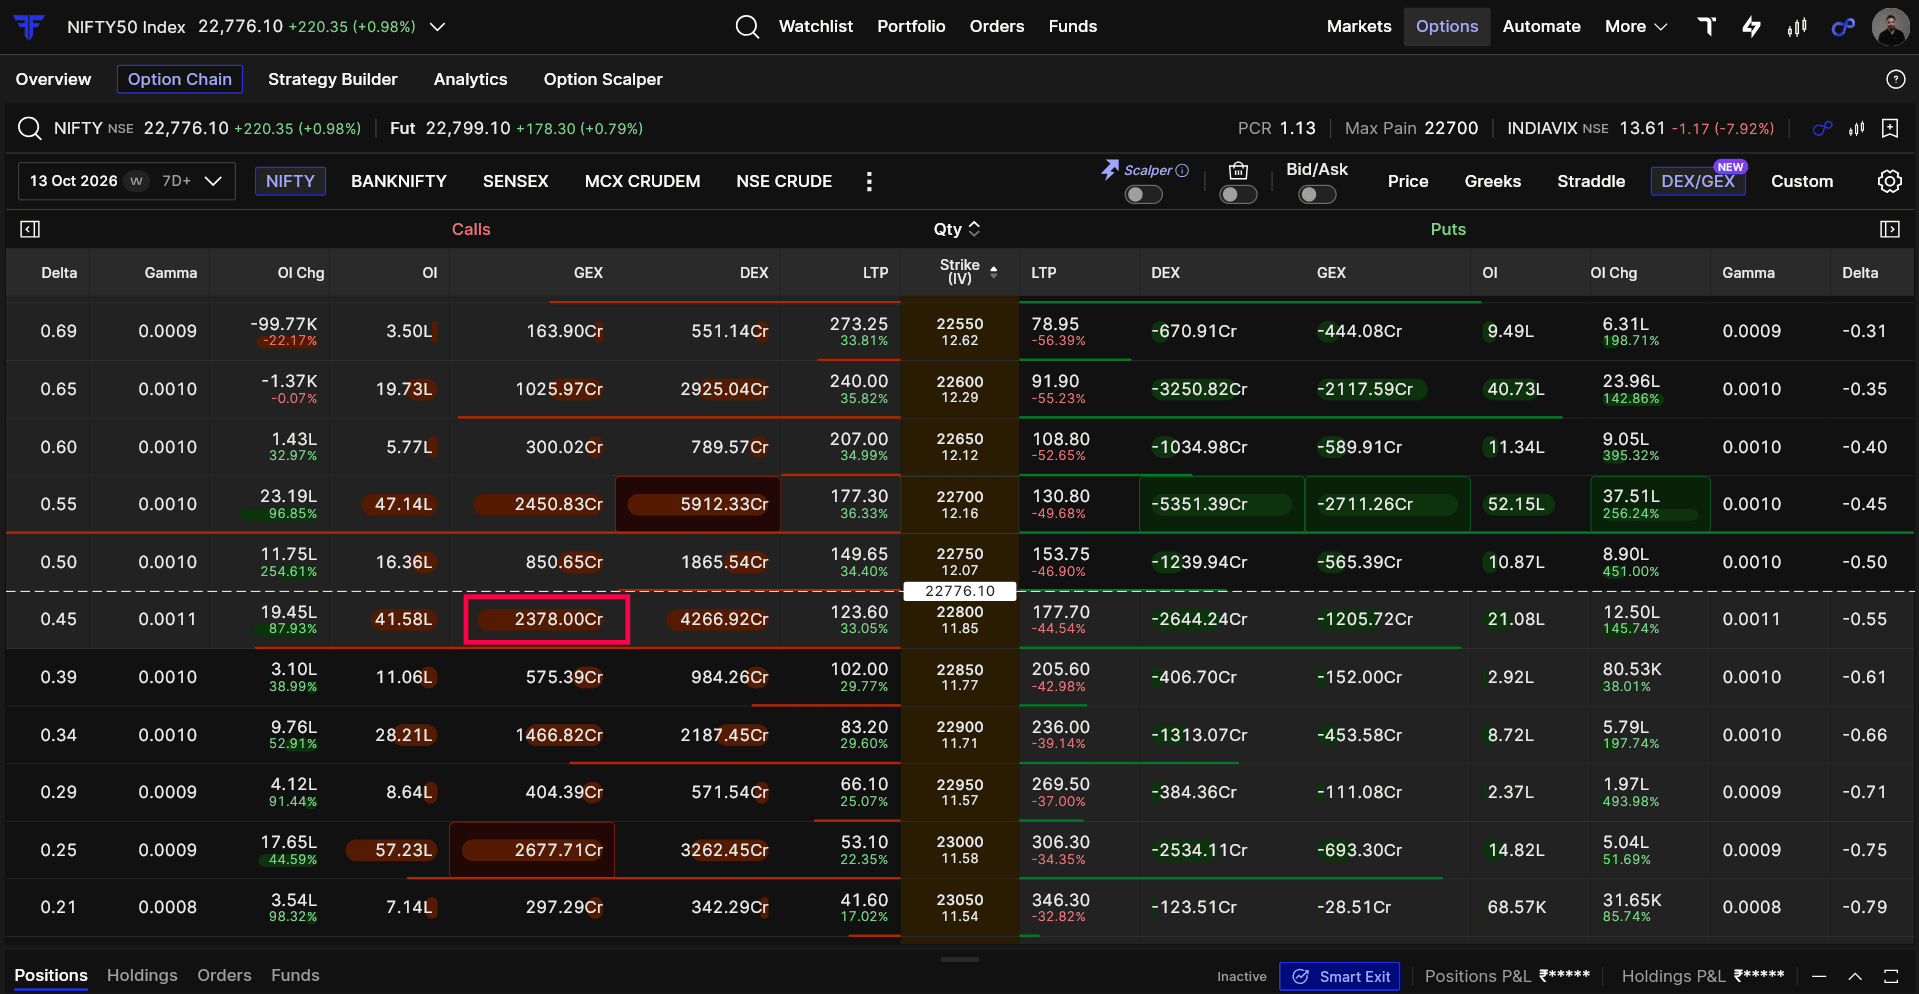
This helps you compare strikes and see where Gamma Exposure is higher. Higher GEX means greater Gamma-related sensitivity across the open positions at that strike.
Looking at GEX along with OI helps you identify which strikes have greater Gamma Exposure, rather than relying only on the number of open positions.
Delta Exposure in Option Analytics
The Option Chain helps you look at numbers for individual strikes. Options Analytics helps you see the bigger picture across multiple strikes using charts.
In the DEX view, you can compare Call DEX and Put DEX across different strikes. There is also Net DEX, which combines both to show the overall directional exposure across the selected strikes.
Another useful level is the Delta Flip. This is where Net DEX changes from positive to negative, or vice versa.
For example, if Net DEX is positive at 22,700 and negative at 22,800, the Delta Flip lies somewhere between these levels.
This tells you that the balance of directional exposure is changing around that area. If NIFTY is trading close to the Delta Flip, it is worth looking at how directional exposure differs on either side of the level.

Understanding GEX in Options Analytics
In the GEX view, you can compare Call GEX and Put GEX across different strikes. You can also switch to Net GEX to see the overall Gamma Exposure across the selected strikes.
Another useful level is the Gamma Flip.
This is where Net GEX changes from positive to negative, or vice versa. It helps you identify where the Gamma Exposure structure is changing.
For example, the Gamma Flip is around 22,750, while NIFTY is trading near 22,776. This means NIFTY is just 26 points away from a level where Net GEX changes sign.
On one side of the Gamma Flip, Net GEX is positive, while on the other side, it is negative. In some market conditions, positive Gamma positioning can be associated with more stable price movements, while negative Gamma positioning can be associated with sharper moves. However, this depends on how market participants are positioned and hedge their exposure.
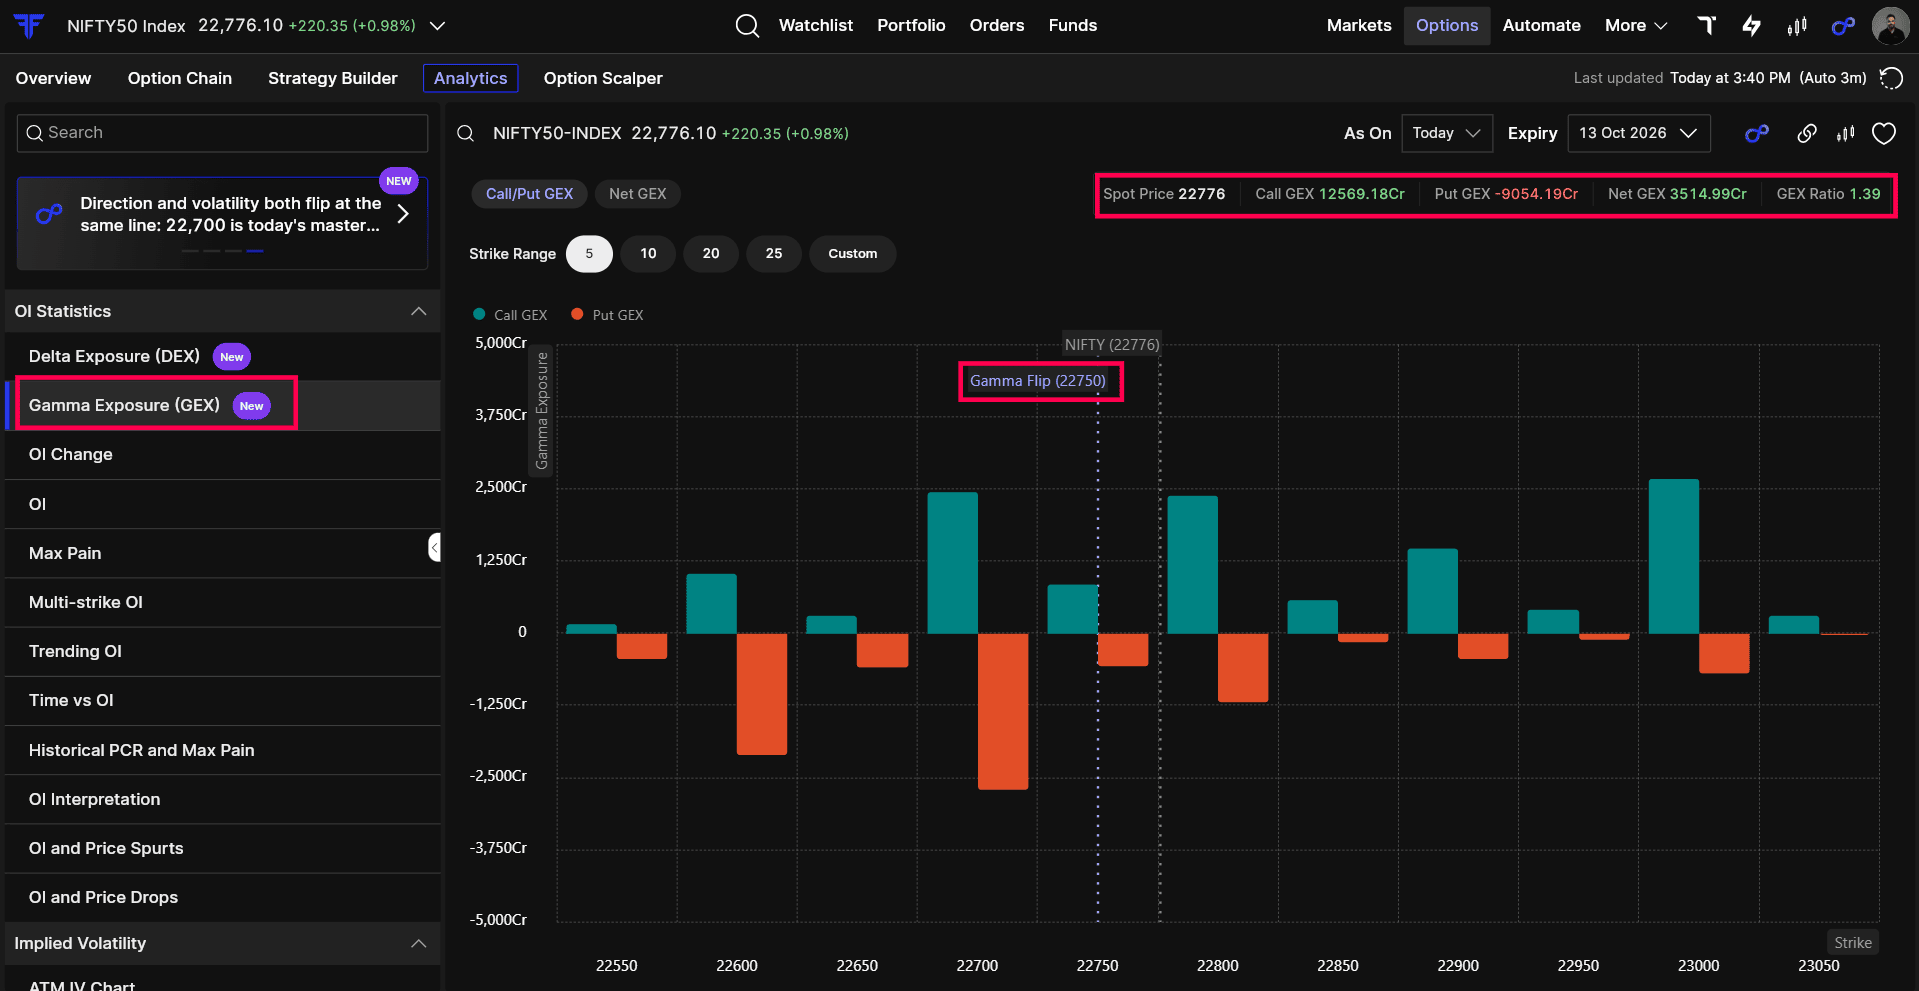
The Gamma Flip gives you a useful reference point when analysing potential changes in market volatility. However, it does not predict whether NIFTY will rise, fall or react at that level.
A Few Simple DEX and GEX Scenarios
Here are some ways to understand what DEX and GEX may be showing you.
| What you see | What it means | What you can understand |
|---|---|---|
| NIFTY is near the Delta Flip | Net DEX is close to changing between positive and negative. | Directional exposure may be changing around this level. |
| NIFTY is near the Gamma Flip | Net GEX is close to changing between positive and negative. | The Gamma Exposure structure may be changing around this level, which can provide context for volatility analysis. |
| One strike has much higher DEX than nearby strikes | More directional exposure is concentrated at that strike. | That strike may be useful to watch when comparing directional exposure. |
| One strike has high GEX | More Gamma Exposure is concentrated at that strike. | That strike may be useful to watch for changes in Gamma sensitivity. |
| Delta Flip and Gamma Flip are close together | Both directional and Gamma Exposure structures are changing around the same area. | This area may be worth watching for changes in exposure and volatility behaviour. |
These are observations, not trading signals. They help you understand what is happening across different strikes, but they should be used along with price action and other market indicators.
Discover the other tools we’ve built in FYERS Option Analytics
Get a Quick Overview With FIA Insights
DEX and GEX charts can show a lot of information at once. FIA Insights helps you quickly understand what stands out.
It highlights changes in exposure, where NIFTY is trading compared to the Flip levels, and important strikes to watch.
This makes it easier to understand the charts without having to study every strike individually.
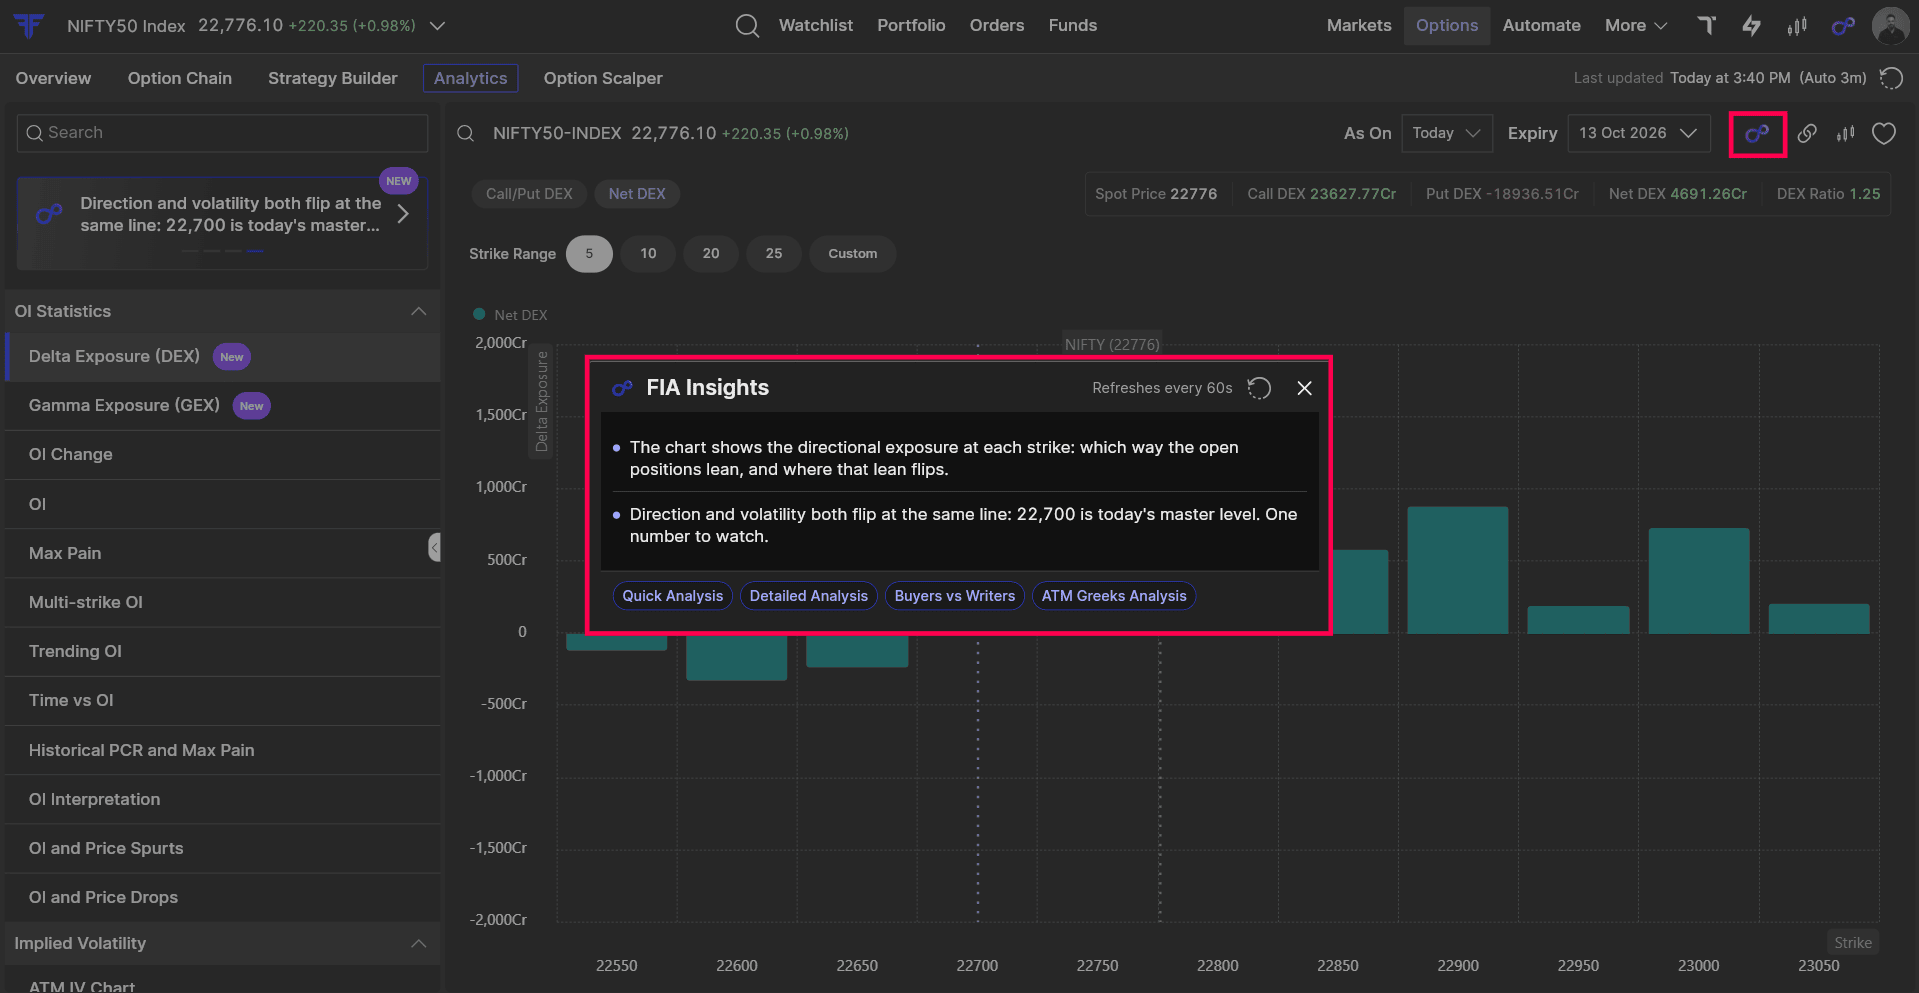
FIA Insights is there to help you interpret the information, not to tell you which trade to take.
A Simpler Way to Use DEX and GEX
Use the Option Chain to understand DEX and GEX at individual strikes, and Options Analytics to see how exposure is distributed across multiple strikes, including the Delta Flip and Gamma Flip levels.
Steps to Access
-
Log in to FYERS.
-
Go to Options → Option Chain.
-
Select DEX or GEX to view exposure by strike.
-
For Analytics, go to Options → Analytics → DEX/GEX.
DEX and GEX work best as additional context alongside OI, Greeks, price action and other analysis.For a step-by-step guide on using them, refer to our Support articles.
Explore DEX and GEX on FYERS
OI shows where positions are concentrated. DEX adds directional exposure, while GEX helps you understand how that exposure can change as the underlying moves.
Together, they help you understand what is happening behind the OI numbers you already watch.
So, the next time you check OI, look at Delta, Gamma, DEX and GEX alongside it. There may be more behind a strike than OI alone can show.