We’ve been quietly adding a lot to FYERS. New indicators, new charting tools. These are the indicators and charting tools we’ve added in the last couple of months.
1. OI Profile
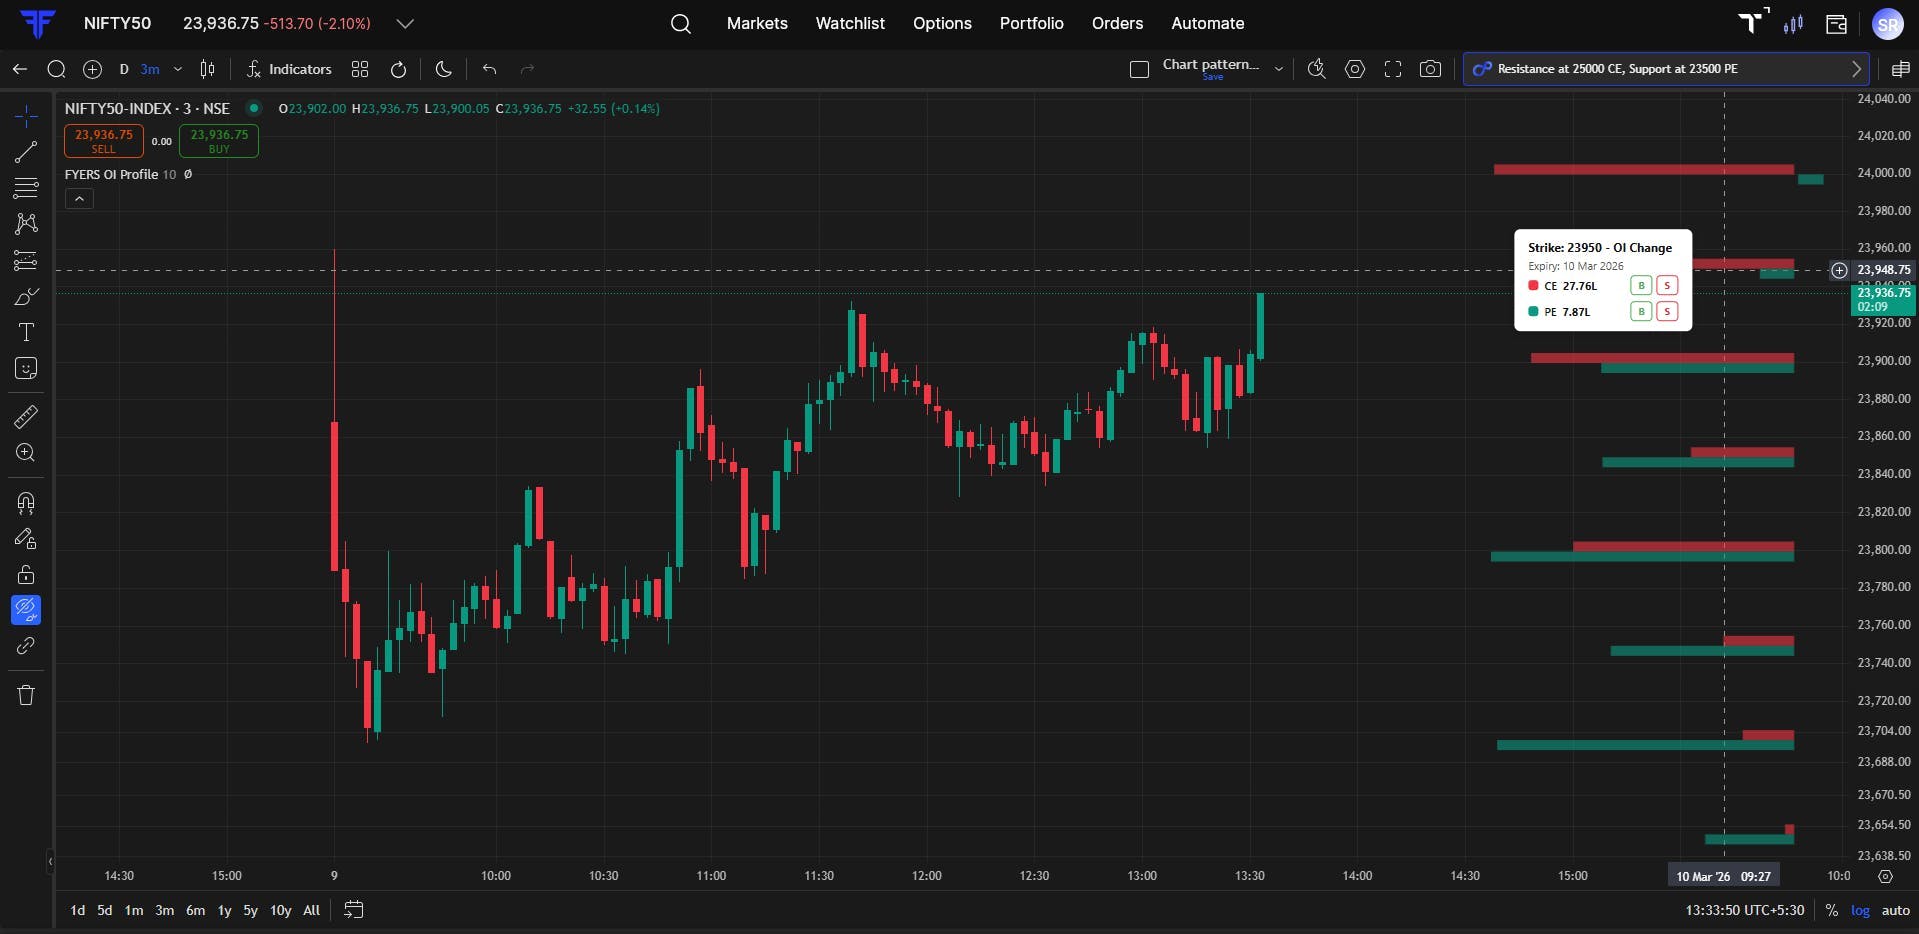
See where contracts are stacking up across strikes, right on your price chart. No need to switch to the option chain. Hover on any bar and you can place a trade directly from there.
To know more, refer to this blog.
2. Open Interest Change
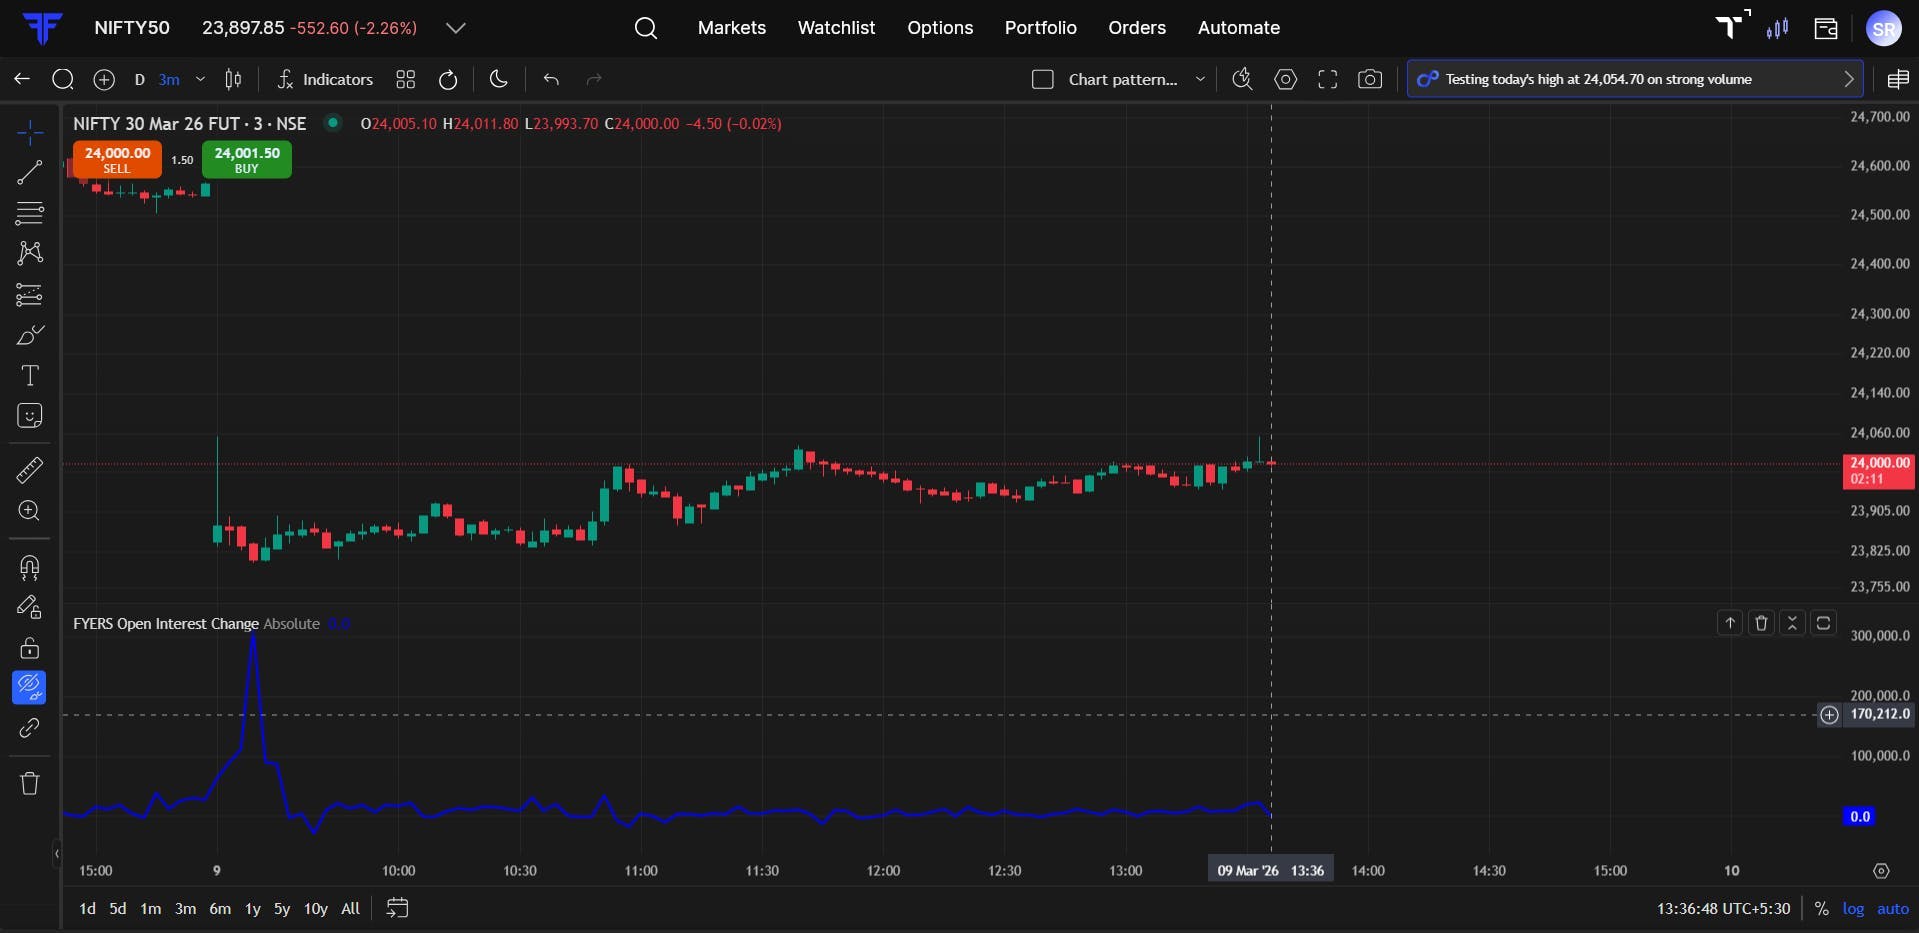
Price can move for different reasons. This tells you whether fresh money is coming in or old positions are just closing out. Same price move, very different story.
To know more, refer to this blog.
3. Auto Fib
Fibonacci levels, drawn automatically. No dragging, no adjusting, no getting the swing points wrong. And when the market makes a new high or low, the levels update on their own.
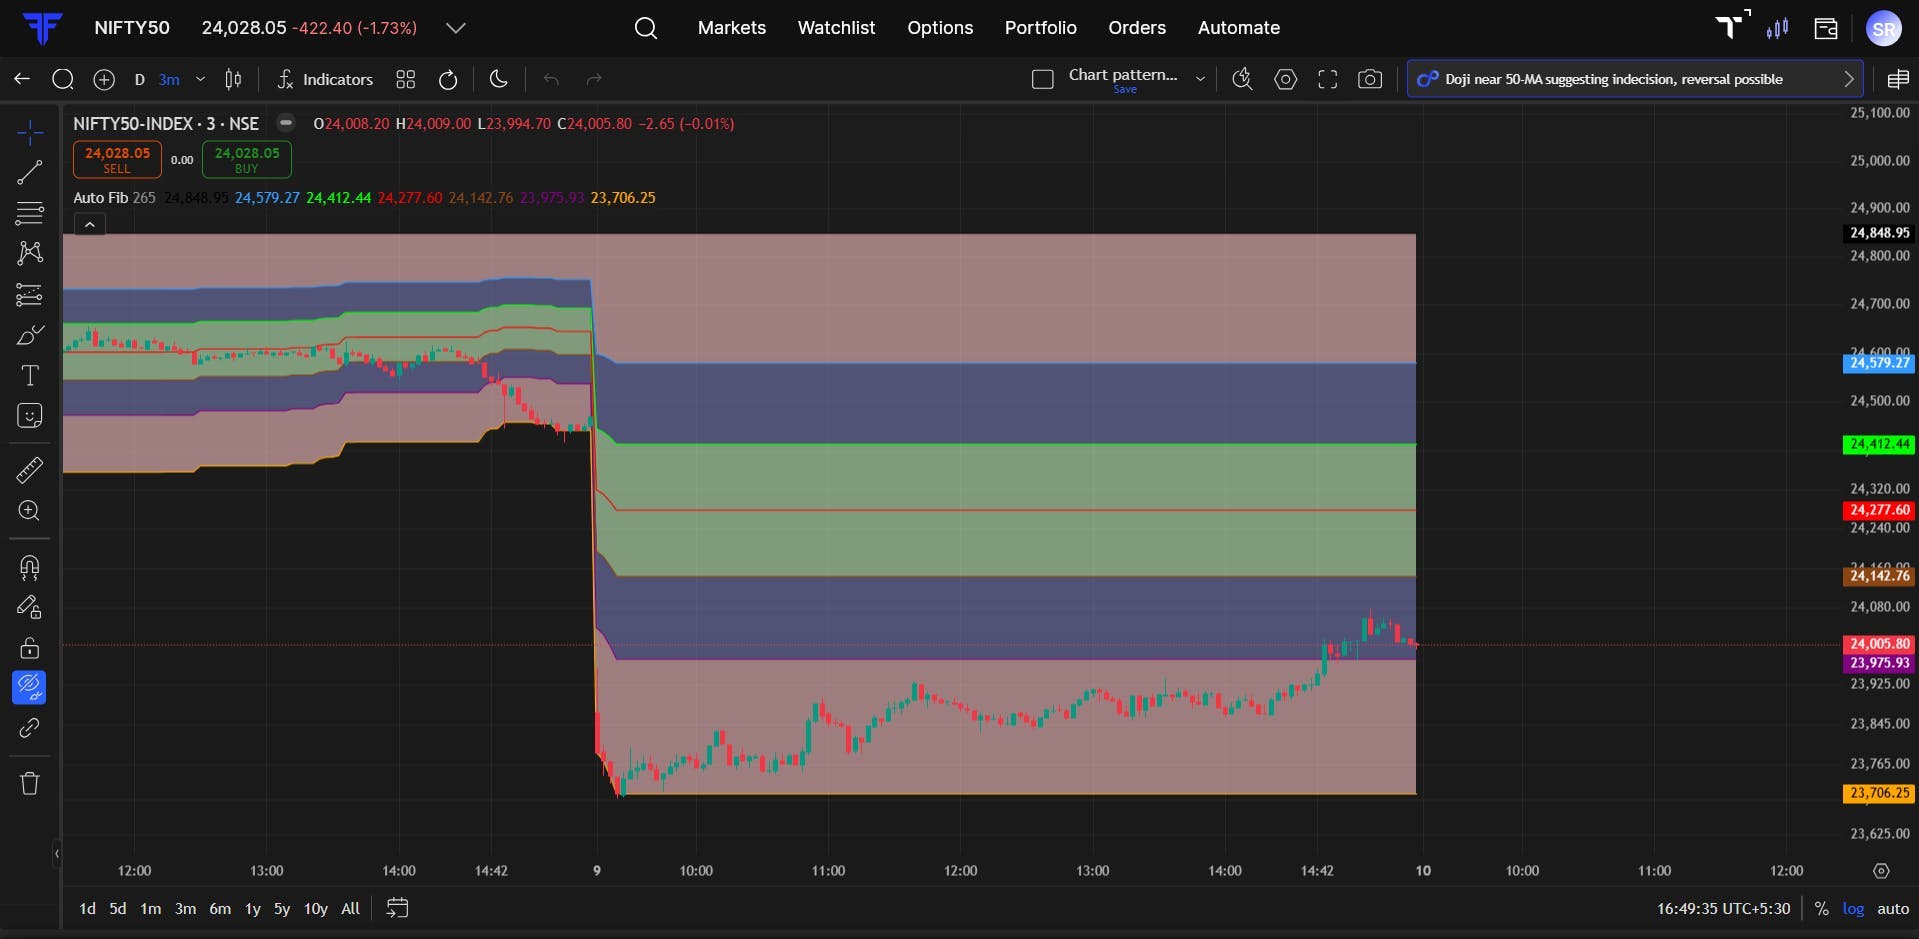
To know more, refer to this blog.
4. Anchored VWAP & Bands
Standard VWAP resets daily. This one lets you anchor it to any point that matters to you, a breakout, an event, a gap. Your reference, your rules.
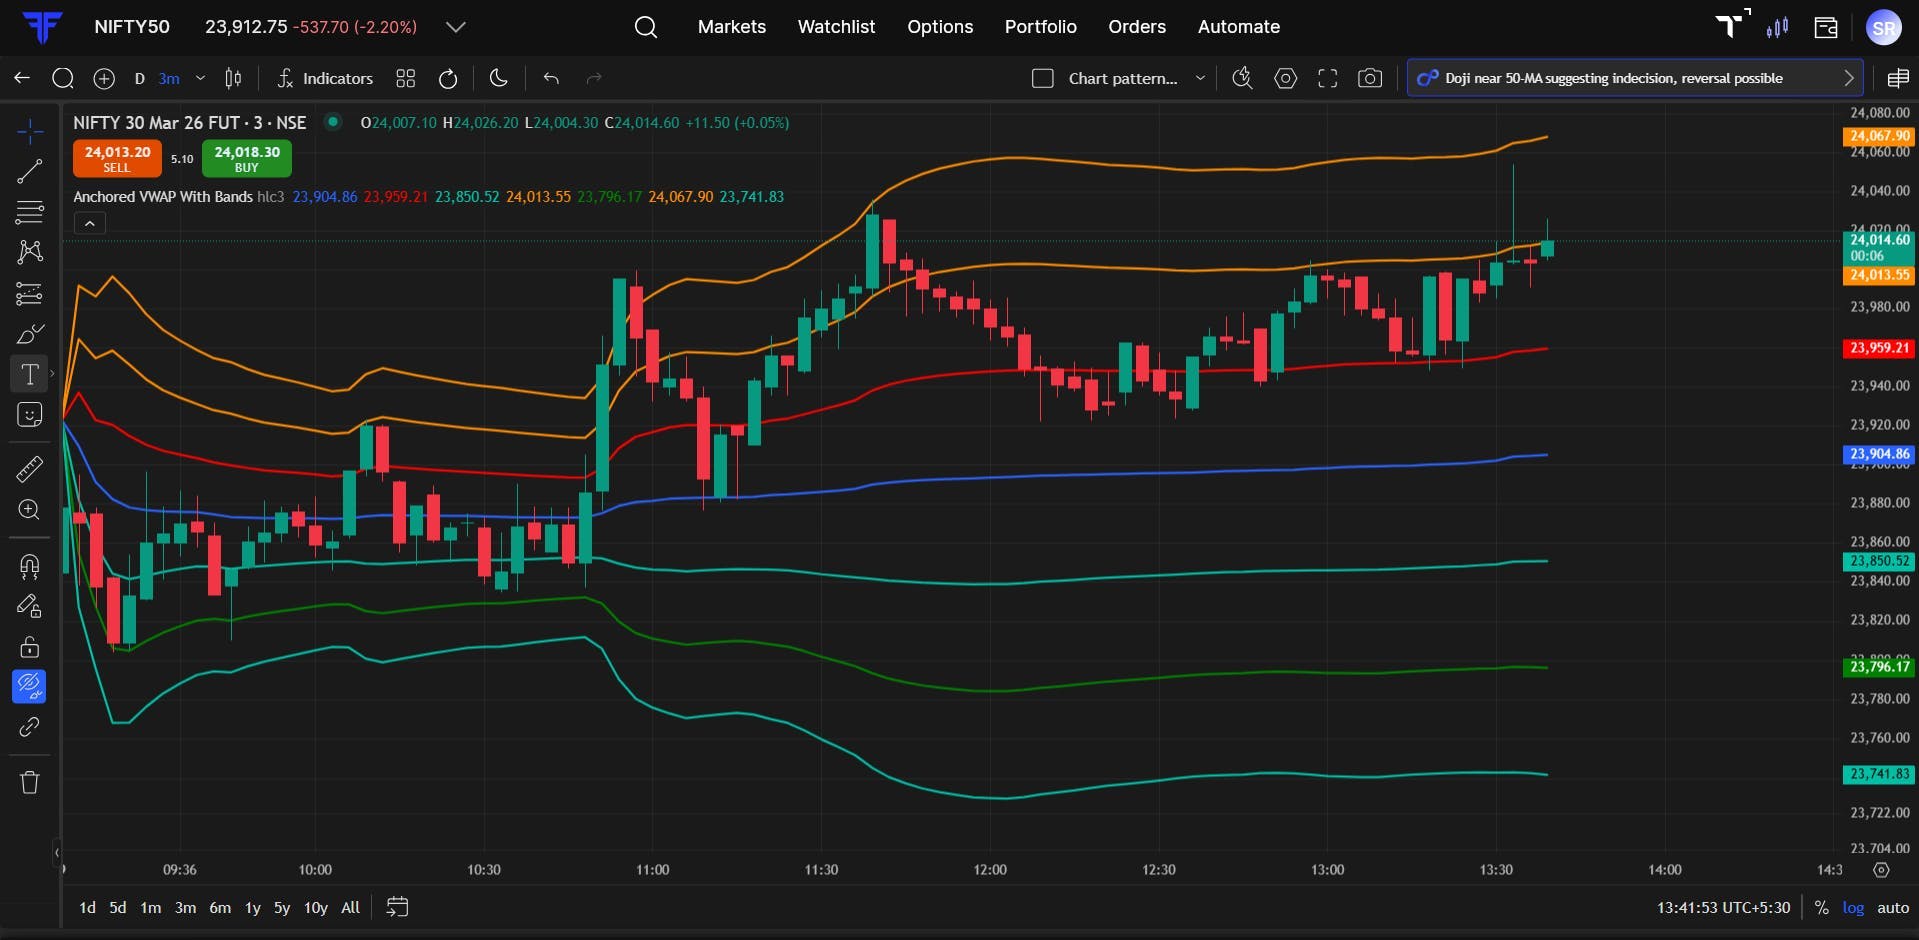
To know more, refer to this blog.
5. Relative Volume
Volume without context is just a number. This tells you if the current trading activity is actually unusual compared to the stock’s own history. A spike to 2x or 3x the average is usually a sign that someone big is moving.
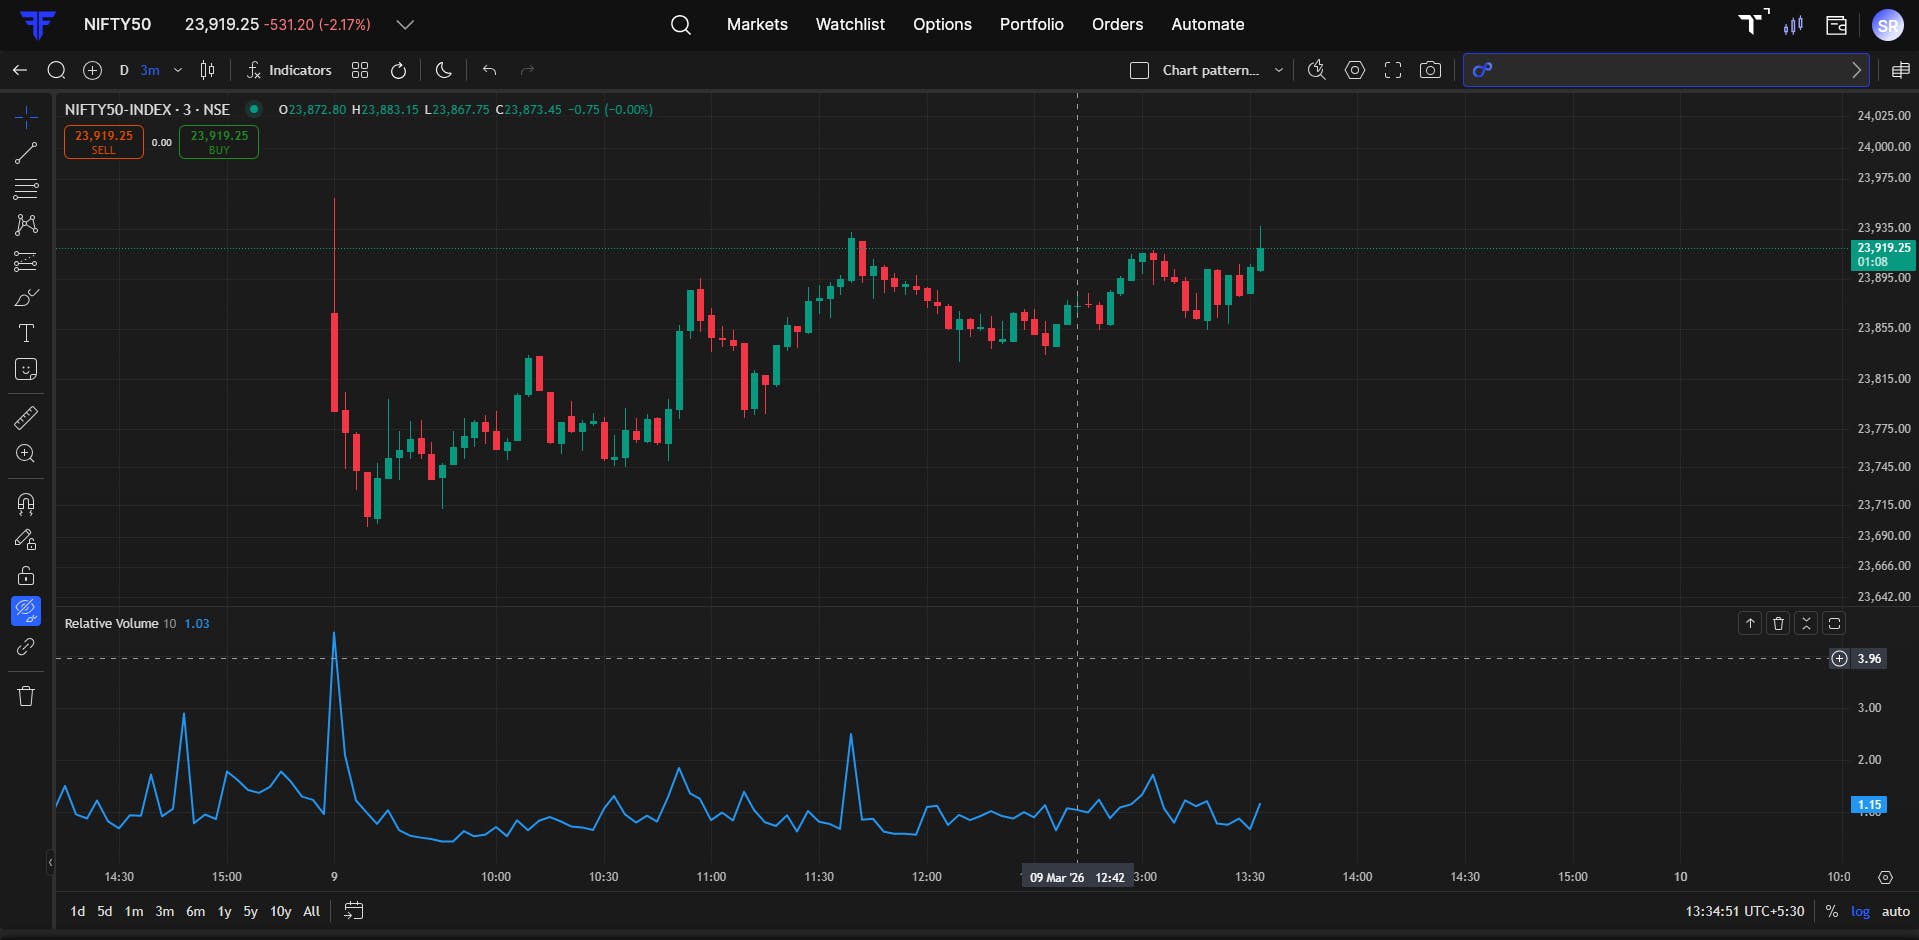
To know more, refer to this blog.
6. Comparative Relative Strength
When everything is green, this tells you which stocks are genuinely leading and which ones are just riding the market up. In a flat market, that difference matters a lot.
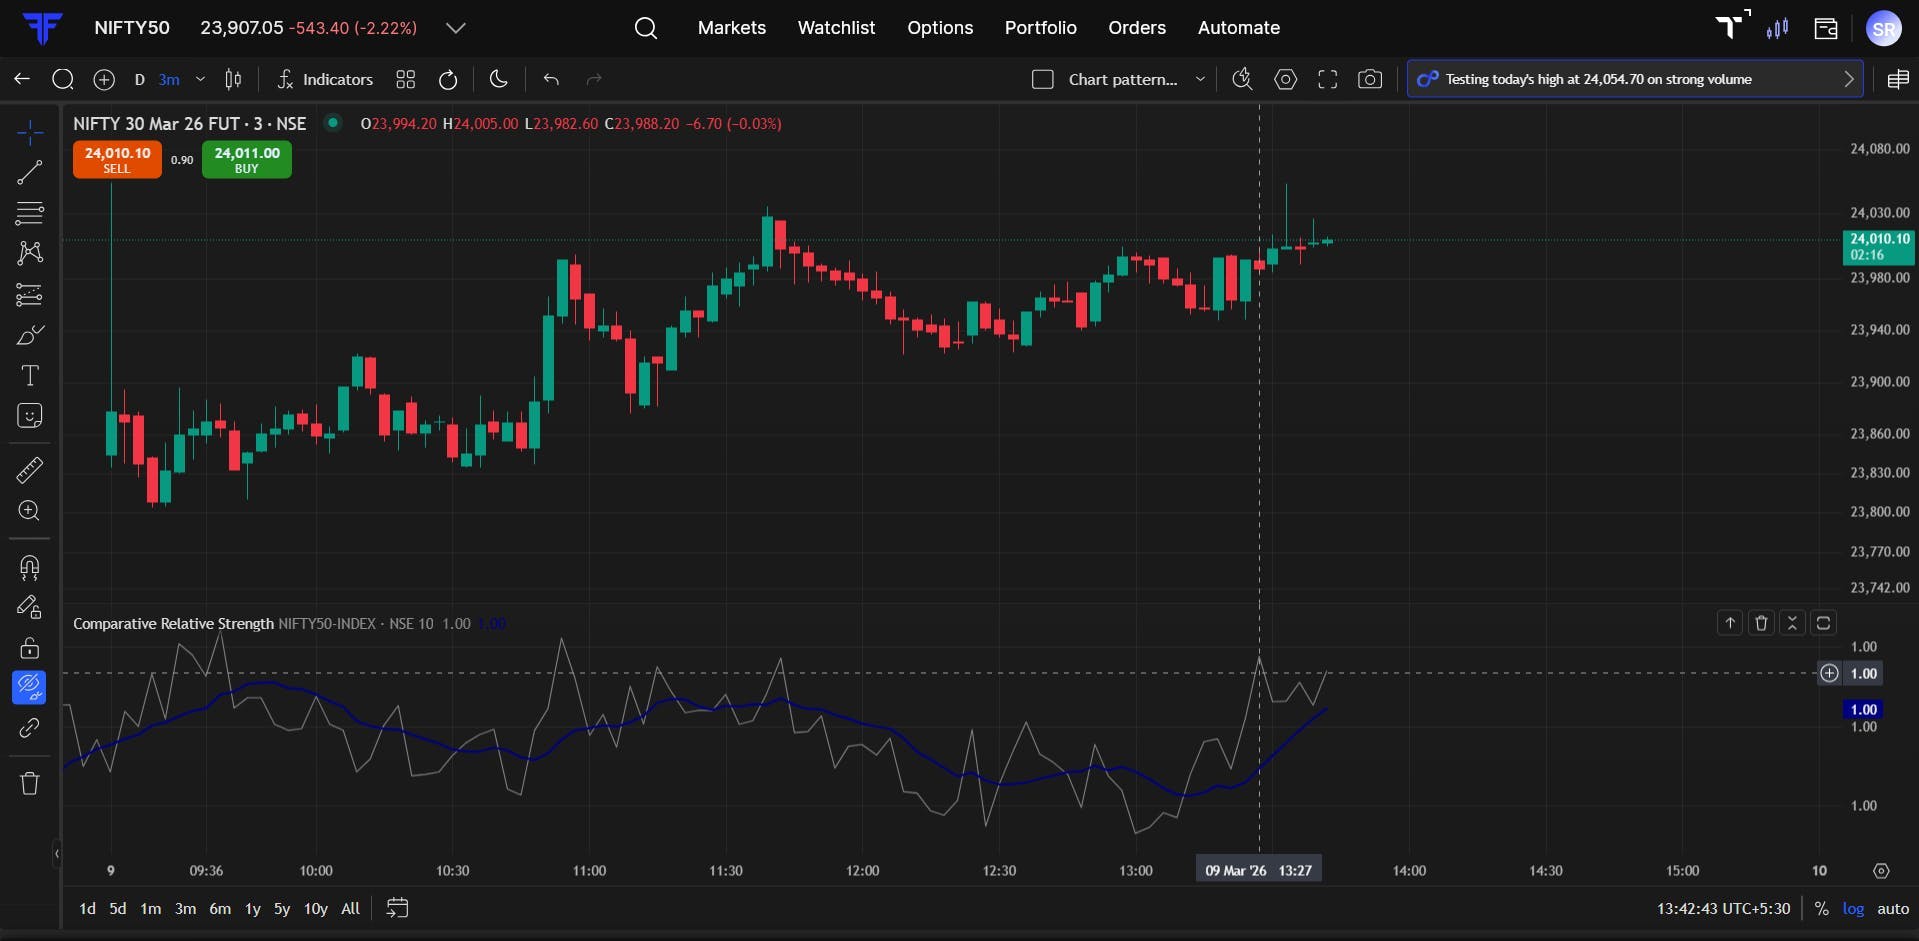
To know more, refer to this blog.
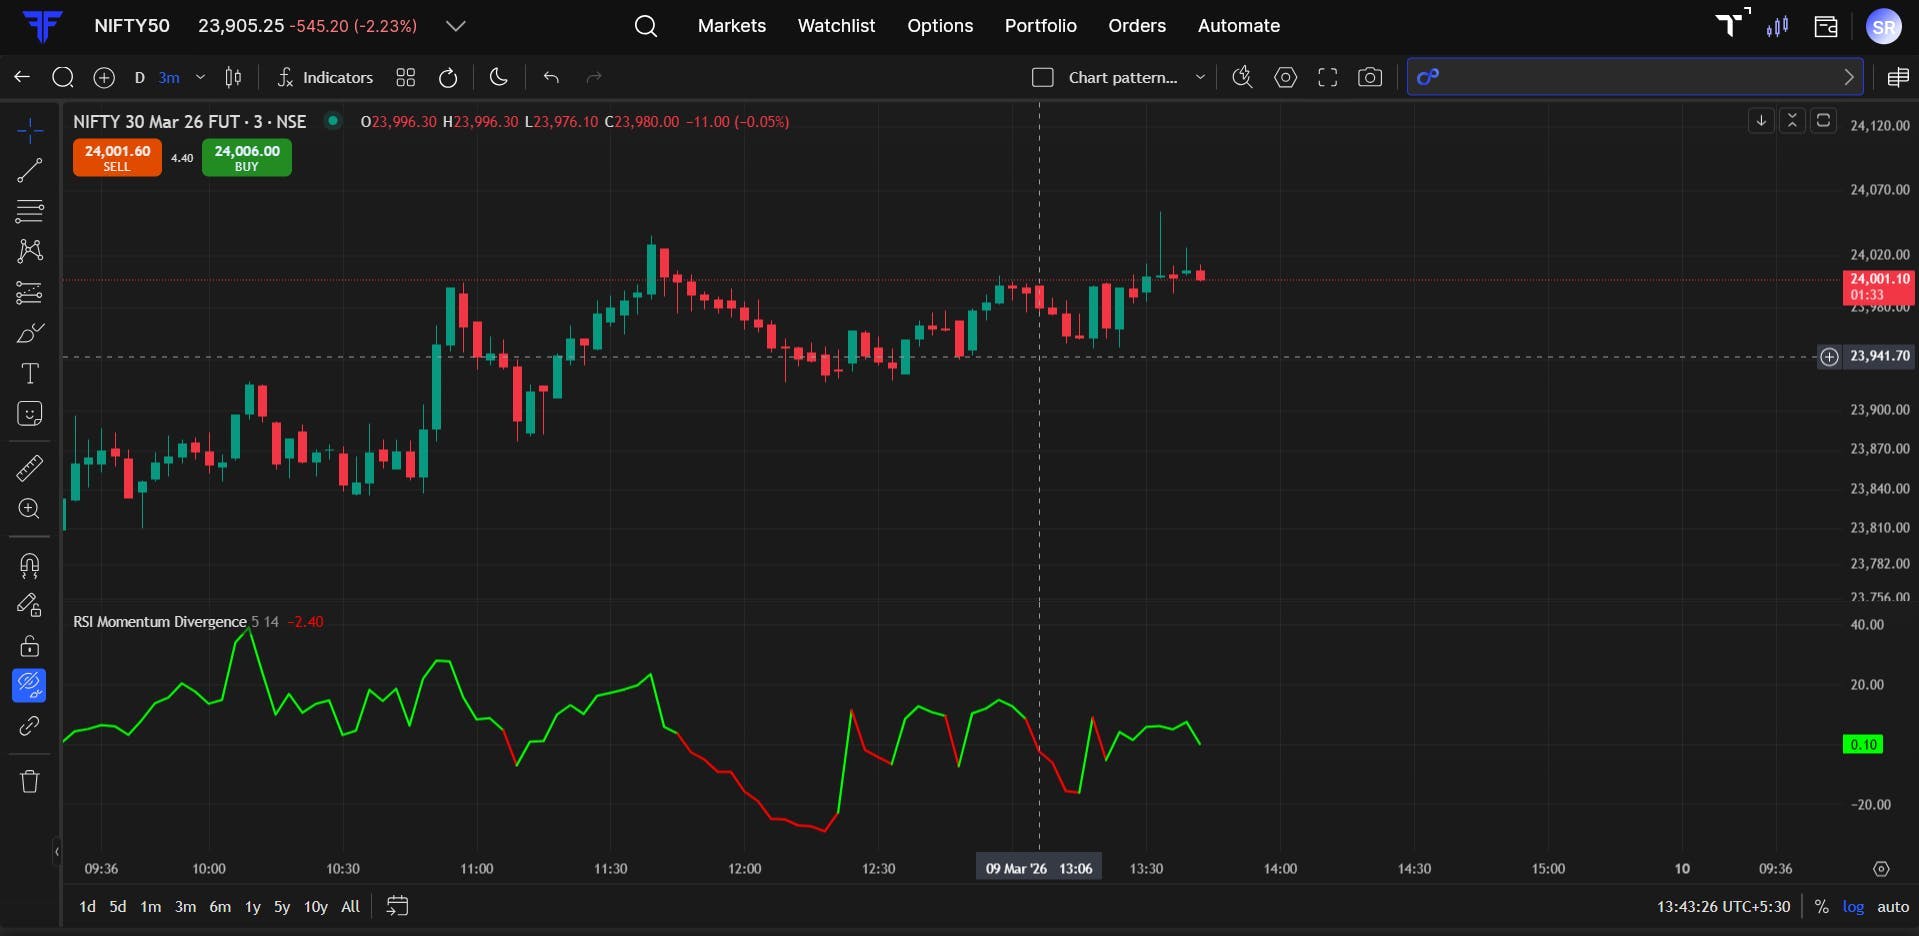
7. RSI Momentum Divergence
Price is still climbing but momentum is quietly fading. This catches that divergence early, before the reversal shows up on the chart. Works the other way too, when price is falling but selling is losing steam.
To know more, refer to this blog.
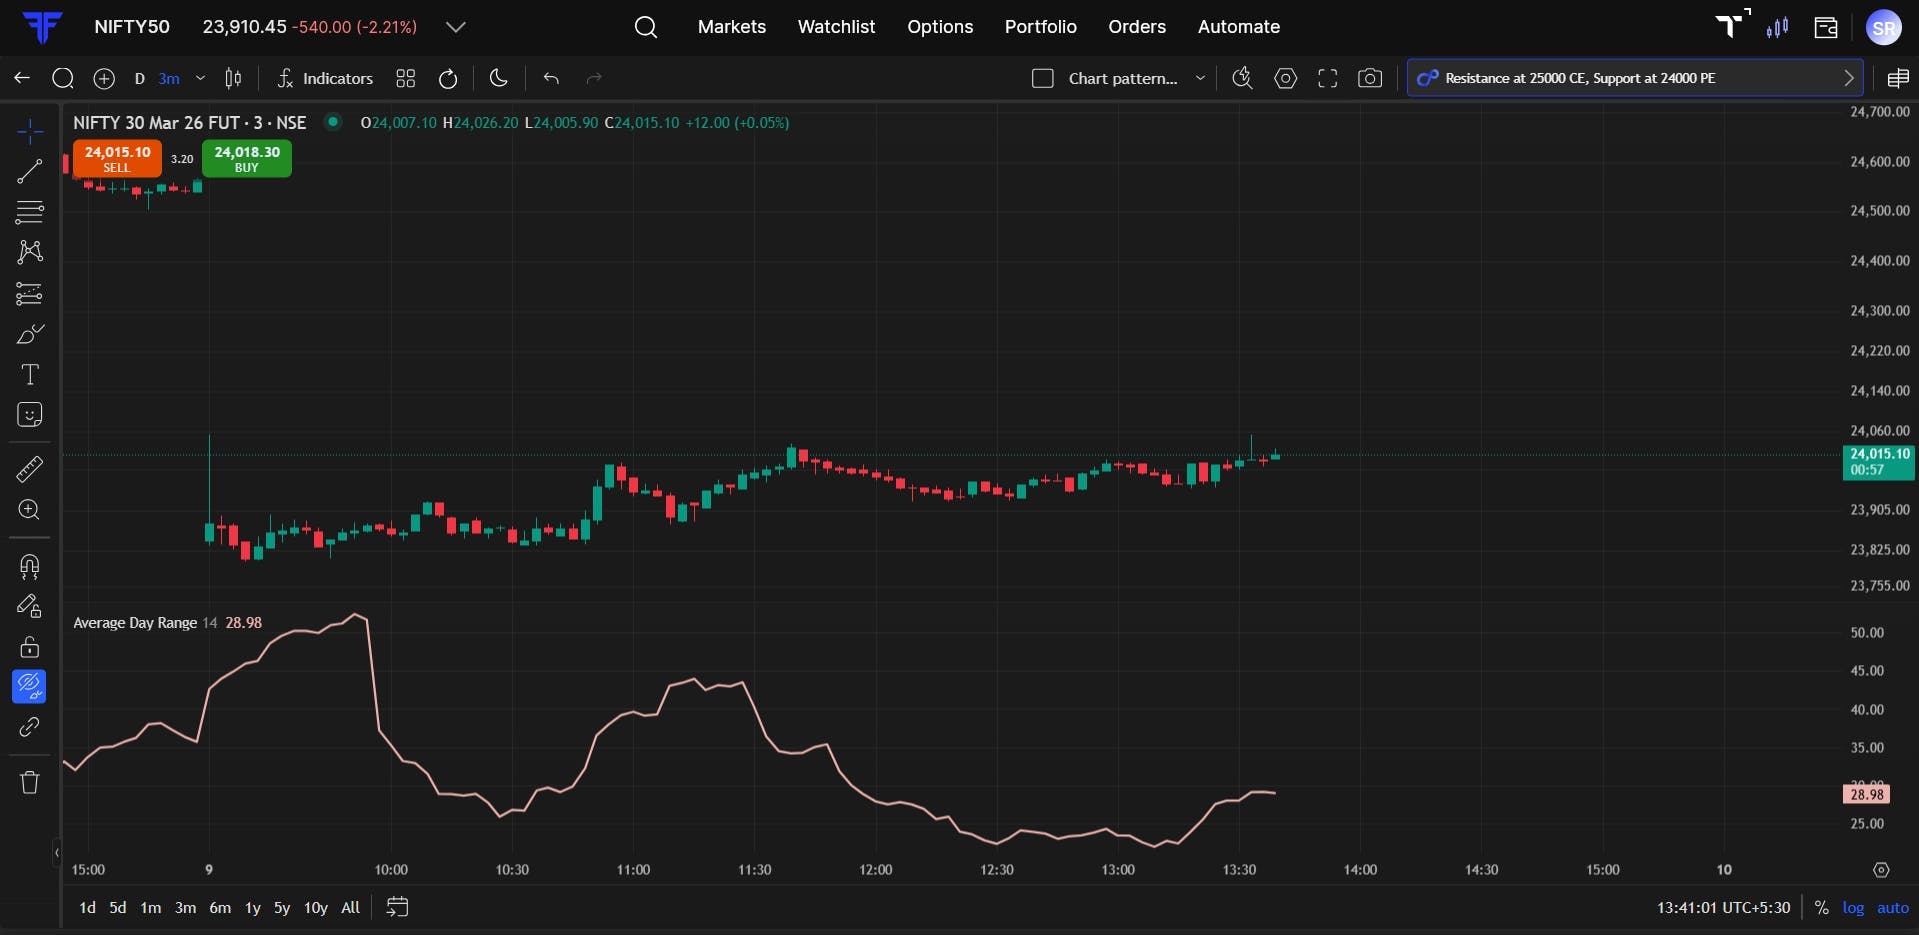
8. Average Day Range (ADR)
Before you enter a trade, it helps to know how much the stock typically moves in a day. ADR gives you that number so you stop guessing at targets and stops. If the stock has already done its usual range, that changes things.
To know more, refer to this blog.
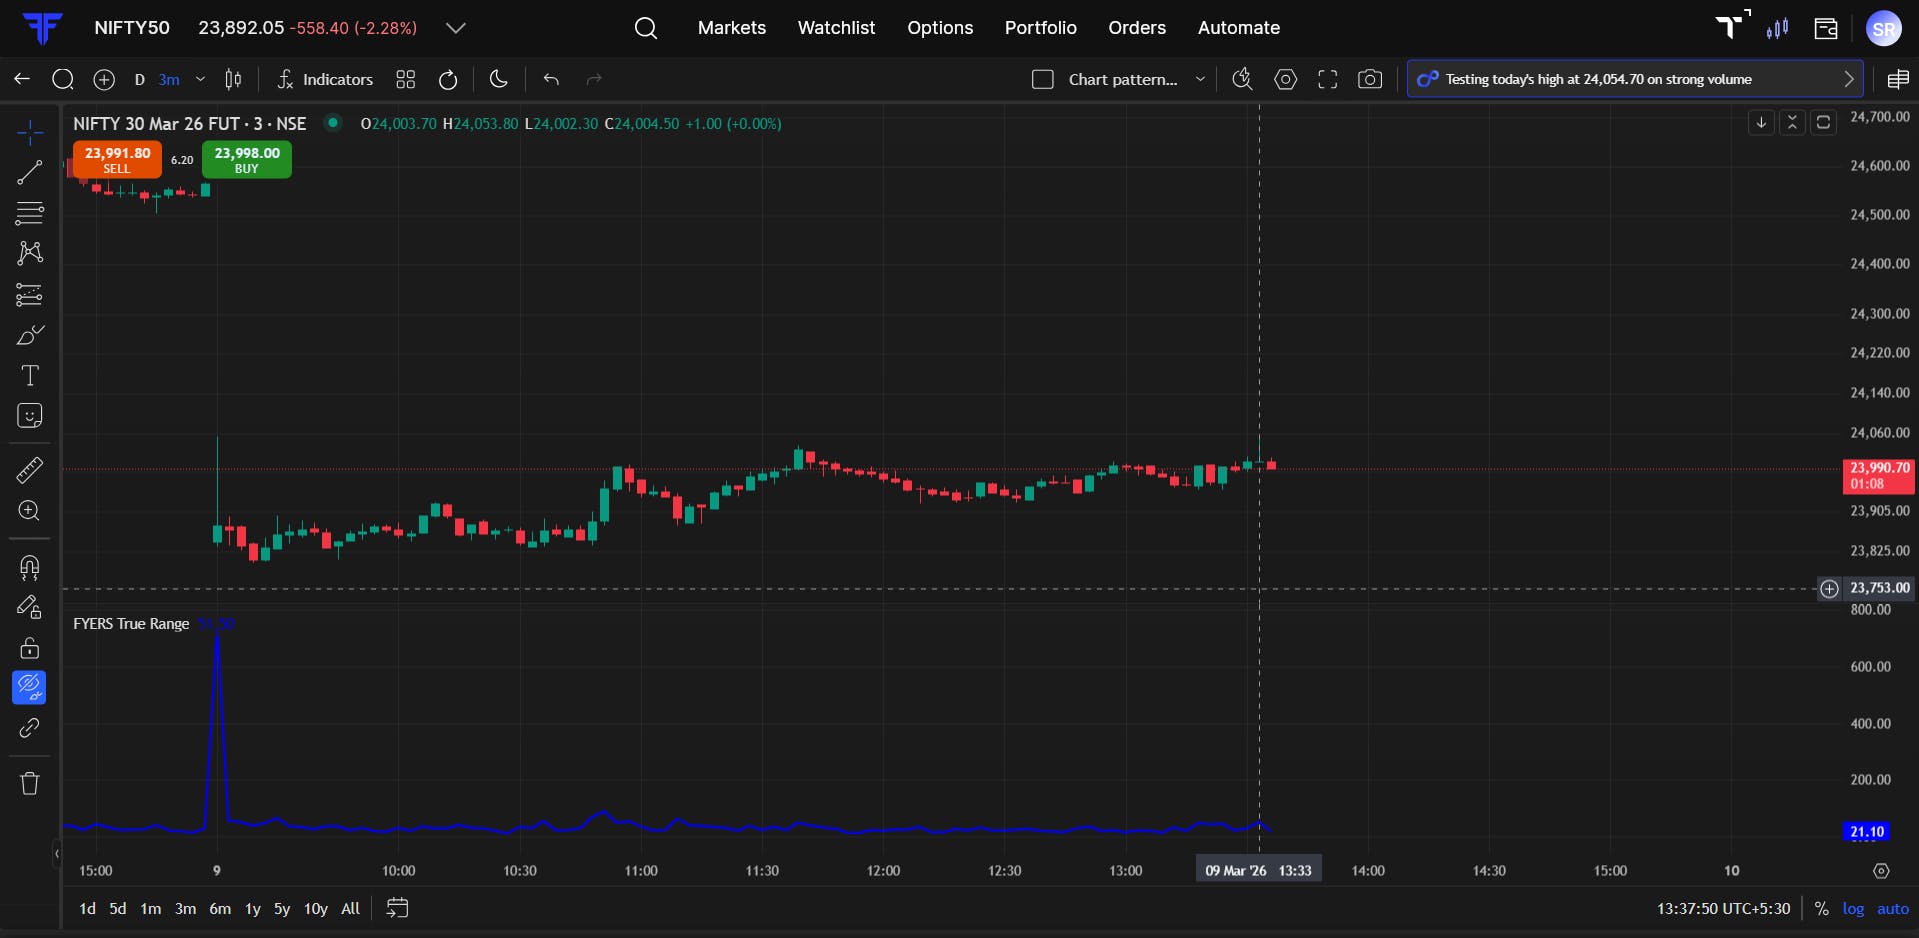
9. True Range
Regular candle size ignores overnight gaps. True Range accounts for them, so your stop loss is based on what the market actually did. Useful on any stock that gaps regularly.
To know more, refer to this blog.
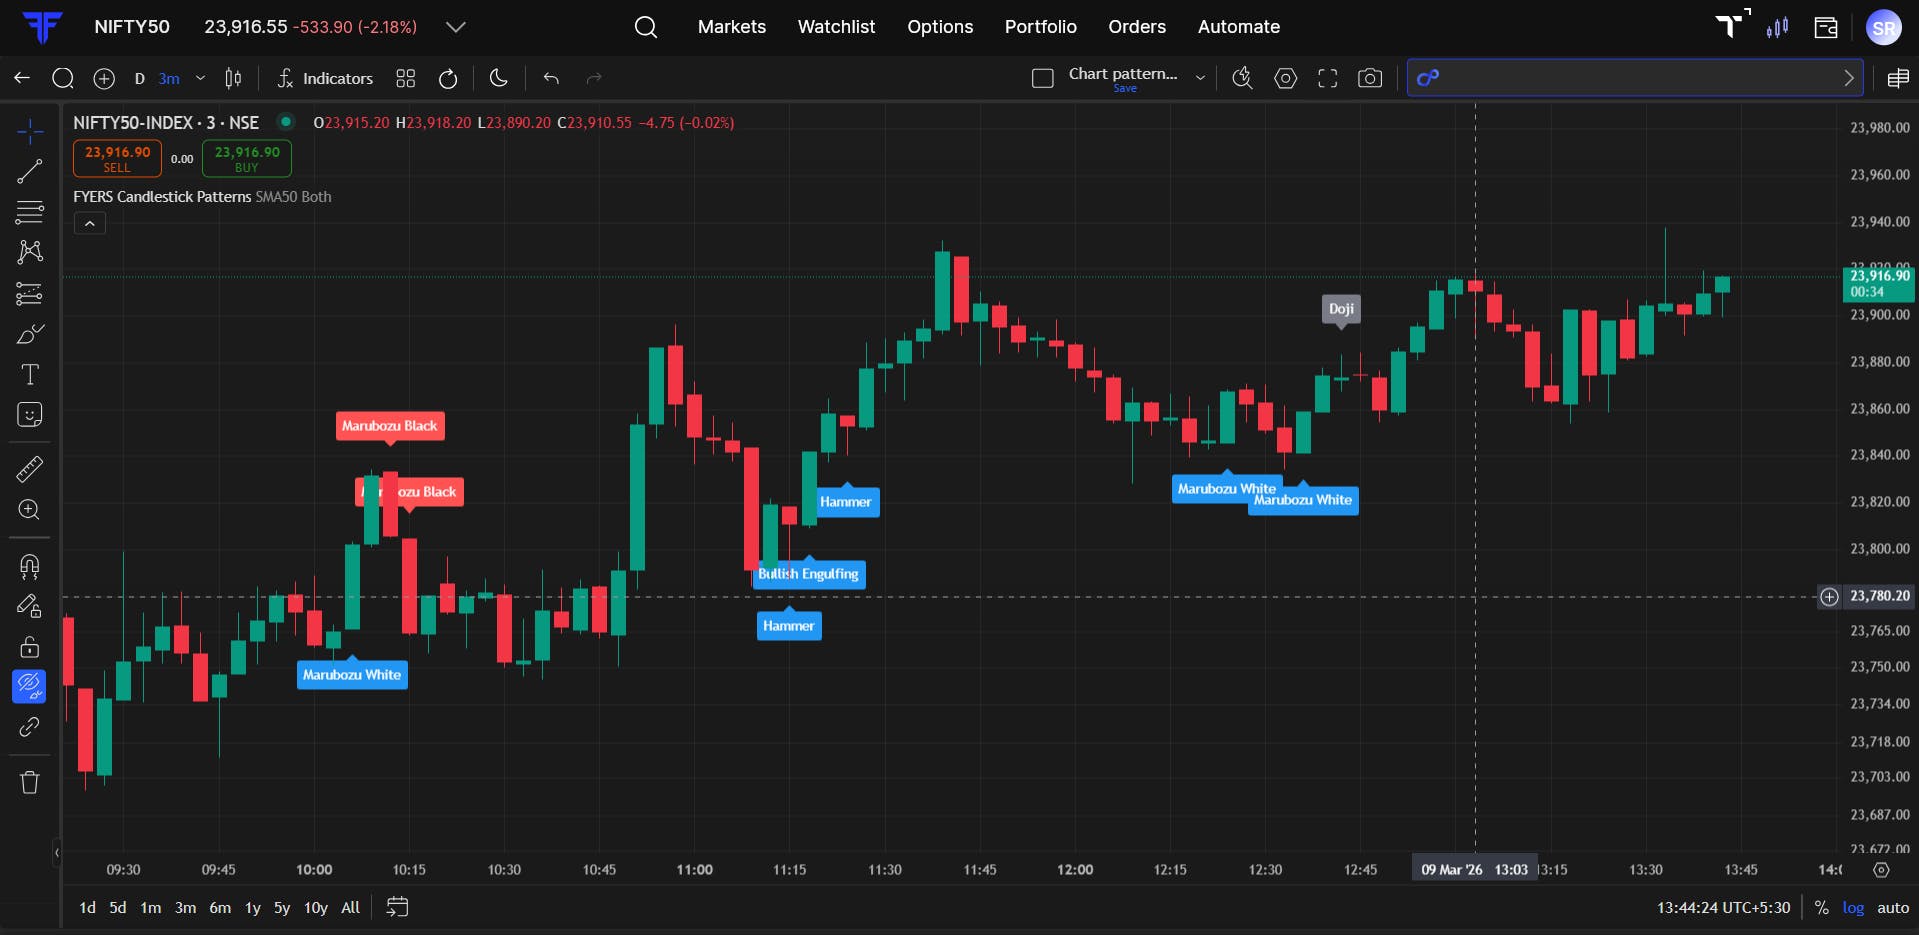
10. Candlestick Patterns
Every hammer, engulfing, and reversal pattern, spotted and labelled on your chart the moment it forms. So you never miss a signal because you were looking elsewhere. You can also turn off the patterns you don’t trade, so your chart stays clean.
To know more, refer to this blog.
Custom Timeframes
We’ve also added the option to add new custom time intervals from minutes to months, whatever your strategy needs. Once added, it stays in your list.
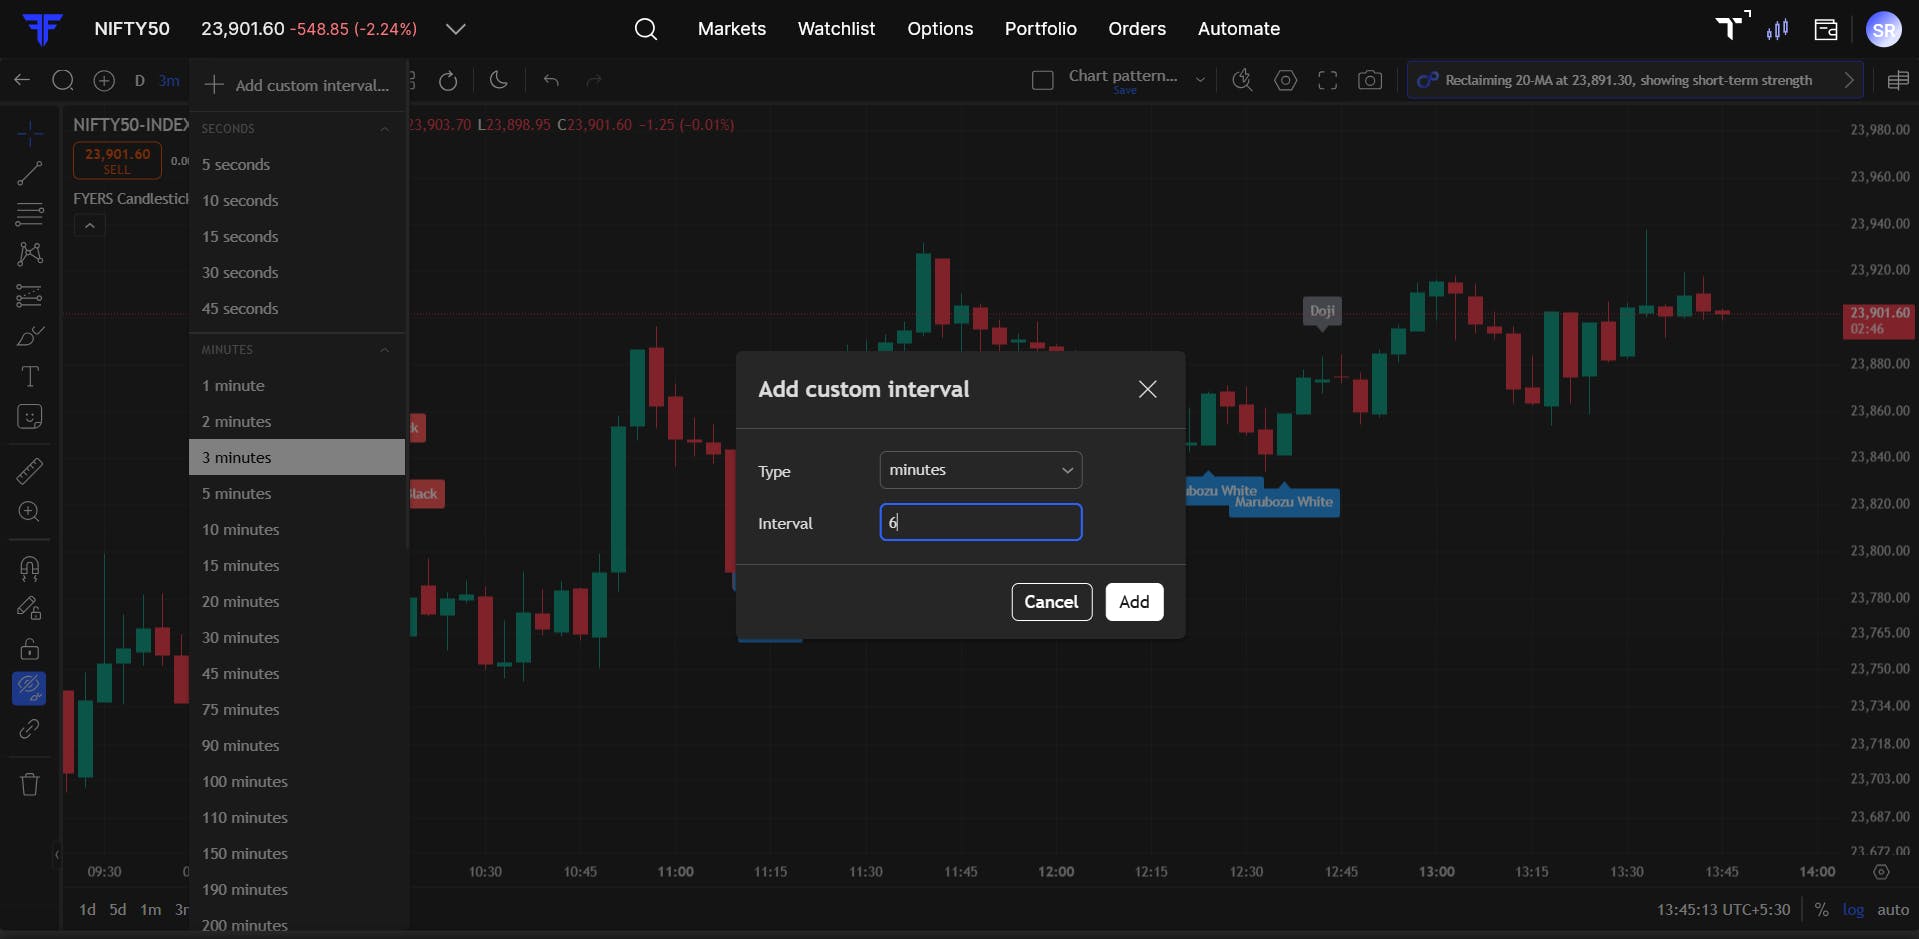
To know more, refer to this blog.
Try them out. And if there is something specific you want us to build next, drop it in the comments.