30 Aug, 2025
 4 mins read
Volume is often the unsung hero of stock market analysis. While most investors chase price charts and breaking news, seasoned traders know that the real story is hidden in volume in stock market data. It tells you how many hands a stock has passed through in a given time, whether buyers are rushing in with confidence or quietly stepping back in caution. Think of it as the heartbeat of the market: steady when calm, racing when excitement or fear takes over. Once you understand what volume in the stock market is, you gain a powerful edge in reading market sentiment and spotting opportunities before they become obvious.
Volume meaning in the stock market refers to the total number of shares or contracts exchanged for a particular security within a specific time frame. It includes both buy and sell transactions, each matched trade adds one unit to the volume count.
Example: If 1,000 shares of a company are traded in a day, the trading volume meaning for that stock is 1,000. High volume typically signals strong interest and active participation, while low volume may indicate limited conviction or caution.
This makes stock market volume explained as not just a number but a reflection of investor activity and conviction.
If you are wondering how volume is calculated in the stock market, it is done by tallying the number of shares or contracts traded during a defined period. Most trading platforms and financial portals display this data automatically.
Common display formats include:
Intraday volume – Tracks trades minute-by-minute or hourly.
Daily volume – Shows total trades completed by the end of the session.
Volume bars – Displayed below price charts; taller bars indicate higher activity.
Average volume – Helps compare current volume with historical norms.
Example: If a stock typically trades 10,000 shares daily but suddenly sees 50,000 shares traded, the spike may signal a major event or shift in sentiment.
Volume data can be segmented to support different trading strategies. The types of volume in trading include:
Trading Volume
The total number of shares traded in a session. It reflects overall market interest.
Buy Volume
Represents trades initiated by buyers willing to pay the ask price. Rising buy volume often signals bullish sentiment.
Sell Volume
Includes trades executed at the bid price, typically initiated by sellers. Increased sell volume may suggest bearish pressure.
Relative Volume (RVOL)
Compares current volume to the average over a defined period. A high RVOL indicates unusual activity and potential volatility.
On-Balance Volume (OBV)
A cumulative indicator that adds volume on up days and subtracts it on down days. It helps confirm price trends and detect divergences.
These variations are often used in volume in technical analysis to confirm price trends and identify reversals.
Volume is a critical tool for validating price action and gauging market strength. Without sufficient volume, even dramatic price moves may lack credibility.
Key reasons volume matters:
Trend confirmation – Price moves with high volume are more likely to sustain.
Reversals – Sudden volume spikes after prolonged trends may signal turning points.
Breakouts – Volume helps confirm breakouts above resistance or below support.
Liquidity – High-volume stocks are easier to trade without large price impact.
Volatility signals – Sharp changes in volume often precede increased volatility.
Volume helps assess:
Market strength – High volume during rallies reflects confidence; low volume may suggest weak support.
Investor interest – Consistently high volume indicates active tracking and trading.
Risk and volatility – Volume surges often accompany news events or speculative moves.
Price stability – Stocks with higher volume tend to have tighter bid-ask spreads and more predictable price behaviour.
Note: NSE and BSE provide real-time volume data, but block trades and off-market transactions may not be immediately reflected.
Volume is a window into market psychology. It helps traders and investors validate trends, anticipate reversals, and manage risk. By combining volume in technical analysis with price patterns, support/resistance levels, and indicators like moving averages or RSI, you can build more robust trading strategies.
It depends on the stock’s average activity. Stocks with daily volume above 1 million shares are generally considered highly liquid. For smaller stocks, consistently high relative volume is a positive sign.
By counting the total number of shares traded during a specific period. Each completed transaction between a buyer and seller adds to the volume.
It suggests increased interest, stronger momentum, and often precedes major price moves or news events.
Not directly. But volume helps confirm price movements and, when paired with other indicators, can signal potential continuations or reversals.
Low volume may indicate poor liquidity, wider spreads, and difficulty entering or exiting trades. It can also reflect weak conviction behind price moves.
Calculate your Net P&L after deducting all the charges like Tax, Brokerage, etc.
Find your required margin.
Calculate the average price you paid for a stock and determine your total cost.
Estimate your investment growth. Calculate potential returns on one-time investments.
Forecast your investment returns. Understand potential growth with regular contributions.
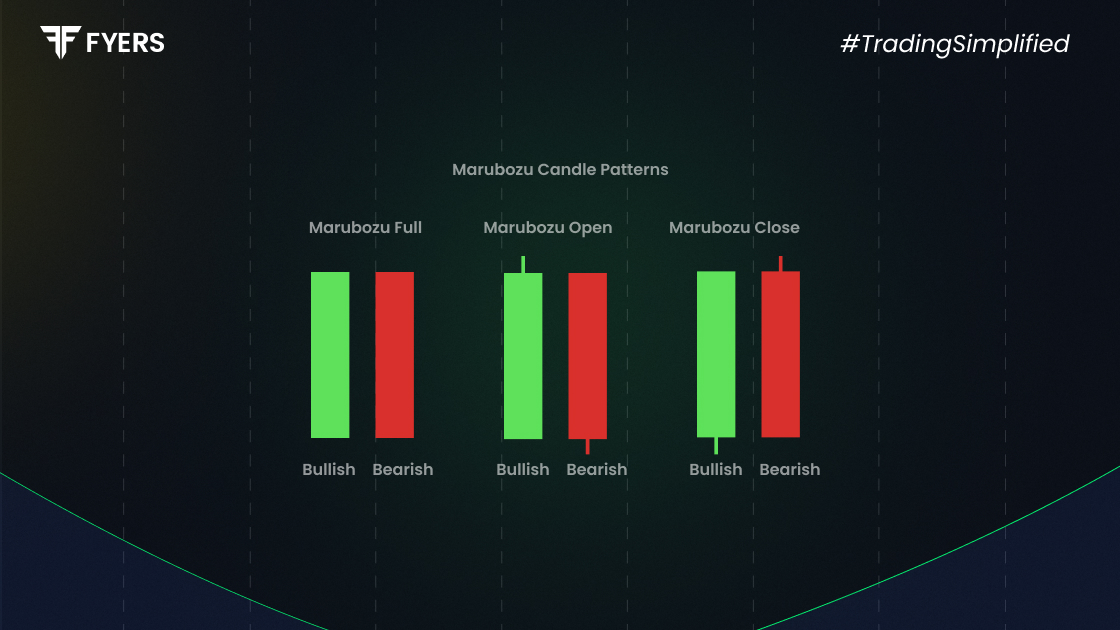
The Marubozu candlestick pattern is a simple yet powerful indicator…
20 Aug, 2025
6 mins read

You have successfully submitted your partnership request form. You will be hearing us soon!