18 Aug, 2025
 4 mins read
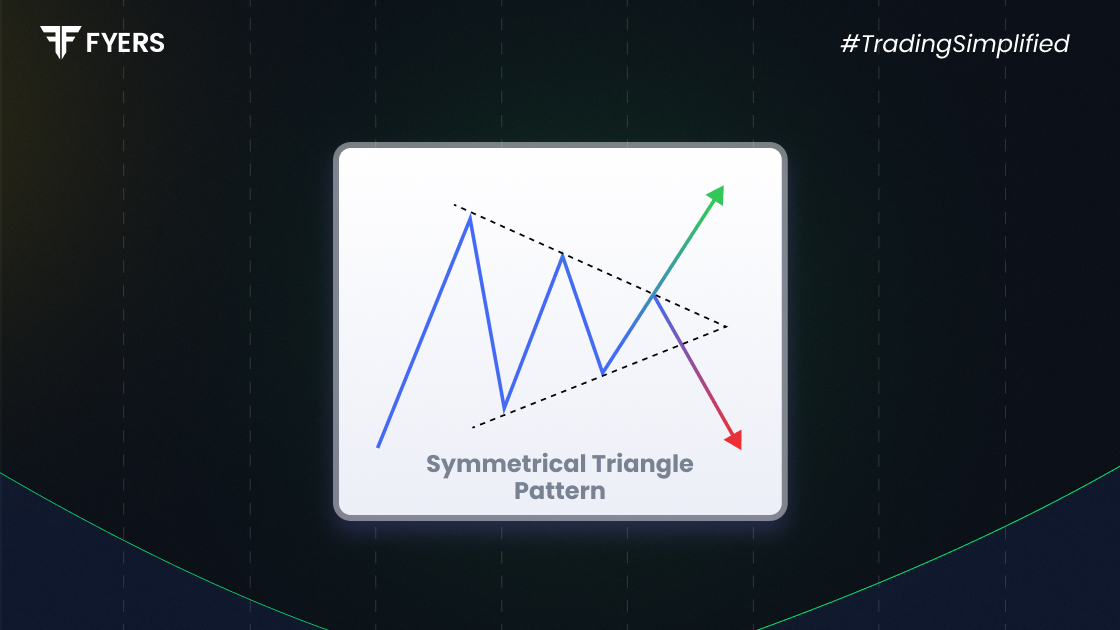
Chart patterns help traders make sense of market movements. One such commonly seen pattern is the symmetrical triangle. It forms when the price of a stock or asset shows indecision in the market, typically before a breakout. This pattern can appear in both uptrends and downtrends, making it a flexible tool for traders.
In this blog, we'll explain the meaning of the symmetrical triangle pattern, its breakout types, how to identify it, and its key characteristics.
A symmetrical triangle pattern forms when two trendlines move towards each other. The upper line slopes down and the lower line slopes up, creating a triangle shape. This means buyers and sellers are in a state of balance, with neither side taking clear control.
The price keeps making lower highs and higher lows, showing tightening price movement. As the lines converge, the chances of a breakout increase.
This pattern usually continues the previous trend, but it can also signal a reversal in some cases. Traders must wait for a breakout above or below the triangle to confirm the next move.
There are two main types of breakouts that can occur from a symmetrical triangle:
A bullish breakout happens when the price breaks above the upper trendline. This suggests that buyers have gained strength, and the price may continue rising. It usually occurs during an uptrend, but can also signal a reversal in a downtrend.
A bearish breakout takes place when the price breaks below the lower trendline. This indicates sellers are taking control, and the price might fall further. This type of breakout is common during downtrends.
Wait for confirmation with strong volume.
Use stop-loss orders just outside the triangle to manage risk.
Set target prices based on the widest part of the triangle added or subtracted from the breakout point.
Several features make this pattern easier to spot and understand. Here are its main characteristics:
Converging Trendlines: The upper line moves down while the lower line moves up, meeting at a point.
Volume Decrease: Volume usually drops during the formation, showing less trading activity.
Neutral Pattern: It doesn’t predict direction until the breakout happens.
Continuation or Reversal: Can lead to either a trend continuation or a reversal depending on market sentiment.
Breakout Timing: Often, the breakout happens around two-thirds to three-quarters of the way through the triangle.
These features help traders understand when the market is preparing for a move and plan accordingly.
Spotting this pattern on a price chart involves a few simple steps:
Check if the price is making lower highs and higher lows. Draw two lines - one along the highs and one along the lows. They should move towards each other.
Volume tends to fall as the pattern develops. This suggests reduced market activity, often followed by a sudden breakout.
Once the price nears the triangle’s apex, be ready for a breakout. Watch for a strong move beyond either trendline with rising volume.
Always wait for a breakout to be confirmed. A false breakout can lead to losses if entered too early.
The symmetrical triangle is a helpful pattern for traders looking to spot possible price moves. It shows a temporary pause in the market, with both buyers and sellers unsure of the next step. By learning to recognise this pattern and waiting for confirmation, traders can make informed entry and exit decisions.
It’s important to use other tools such as volume and support/resistance levels to confirm signals. Whether you trade intraday or over longer time frames, this pattern can be a valuable part of your technical analysis toolkit.
It’s a chart pattern where the price moves within narrowing lines, showing that the market is undecided. The price could break out in either direction once it nears the tip of the triangle.
It’s generally reliable, especially when combined with volume and other indicators. However, like any pattern, it isn’t 100% accurate and should be used with proper risk management.
Yes, intraday traders often use this pattern. It can signal upcoming breakouts during shorter time frames, provided you wait for confirmation.
Calculate your Net P&L after deducting all the charges like Tax, Brokerage, etc.
Find your required margin.
Calculate the average price you paid for a stock and determine your total cost.
Estimate your investment growth. Calculate potential returns on one-time investments.
Forecast your investment returns. Understand potential growth with regular contributions.

You have successfully submitted your partnership request form. You will be hearing us soon!