13 Jun, 2024
 7 mins read
Fibonacci patterns have been part of our world for ages, ingrained around us in different areas like architecture, shells, tree patterns, flowers and more. However, the same Fibonacci retracements are also used in trading to understand the nuances of the price movements and find key support and resistance levels. So, how do you use them for trading? Check out this blog to learn all about Fibonacci Retracements and effective strategies for trading with Fibonacci Retracements.
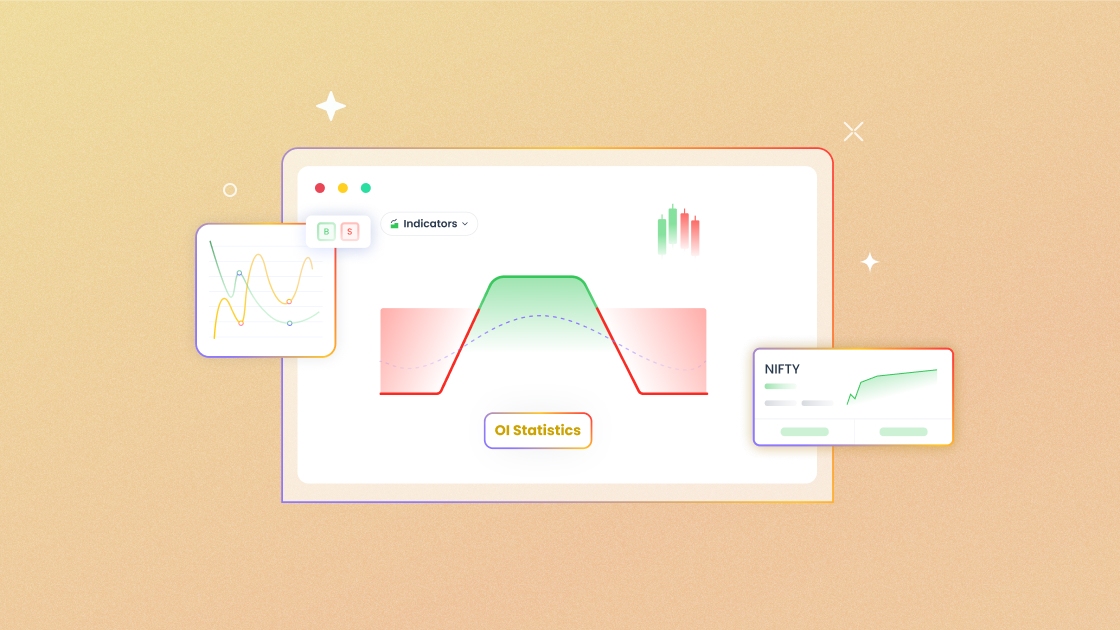
Fibonacci Retracement is a popular technical analysis tool traders use to identify potential support and resistance levels in a financial asset's price movement. It is based on the key Fibonacci ratios derived from the Fibonacci sequence (23.6%, 38.2%, 50%, 61.8%, and 100%). This sequence predicts significant price levels where a stock or other asset might reverse or stall.
Traders apply Fibonacci Retracement levels by identifying the high and low points of a recent price move and drawing horizontal lines at these key ratios. These levels help traders anticipate potential price movements, which can be used to make informed trading decisions, such as identifying key entry-exit points or implementing risk management techniques like stop-loss orders.
Fibonacci retracements are among the fundamental tools of technical analysis for traders. Here’s how to use Fibonacci Retracements for trading.
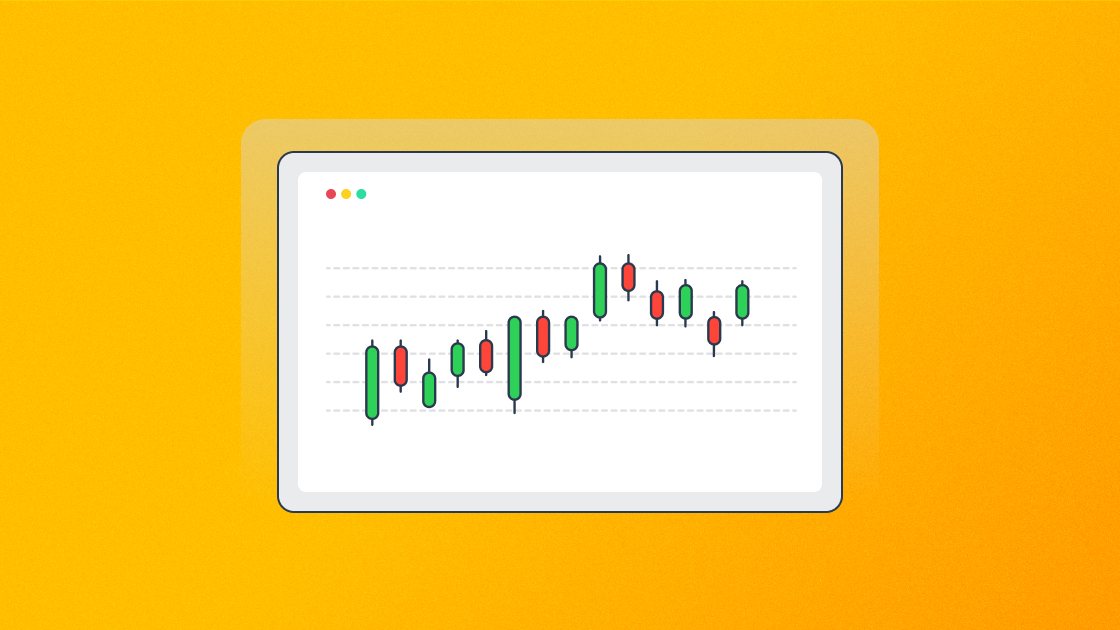
Using Fibonacci Retracements in trading begins by identifying the prevailing market trend. Traders have to determine whether the security or the asset in consideration is in an uptrend or downtrend. The next step is to draw the retracement from the recent low to the high in an uptrend, while in a downtrend, retracement should be drawn from the recent high to the low. This setup is useful in understanding and establishing the retracement levels for analysis.
Traders can also use the Fibonacci Retracement tool available on the trading platform to draw the levels on their charts. The tool can plot the key Fibonacci ratios (23.6%, 38.2%, 50%, 61.8%, and 100%) by selecting the high and low points of the significant recent price move. These ratios serve as traders' potential support and resistance levels and help analyse price movements.
Once the Fibonacci levels are plotted, the next step is to observe the price action as it approaches these levels. Traders should confirm the trading signals using other technical analysis tools like indicators, candlestick patterns, volume spikes, etc. These additional analysis tools help validate potential reversals or continuations around the Fibonacci levels.
Fibonacci Retracement levels can be used to pinpoint precise entry and exit points for a security. For example, traders can consider entering a long position in an uptrend if the price retraces to the 38.2% or 50% level and shows signs of bouncing back. After adjusting the trading strategy based on trend strength, they can set profit targets at higher Fibonacci levels like 61.8% or 100%.
Fibonacci Retracements can also be used to refine risk management techniques like placing stop-loss orders just beyond key levels. For example, if the price is entering at a 50% retracement level, traders can put a stop loss below the 61.8% level to limit potential losses. These techniques help protect the capital and give the traders a breather to move.
Fibonacci Retracements are versatile trading tools that can be used across different time frames and to suit different trading styles. Day traders might use shorter time frames, like 15-minute or hourly charts, while swing traders prefer daily or weekly charts. The adjustment of different time frames allows for identifying relevant levels for their trading horizons.
The Fibonacci Retracement levels are defined based on the Fibonacci sequence and ratios. These key levels and their interpretation are explained hereunder.
This level is considered a shallow retracement and indicates a minor correction within the prevailing trend. It suggests that the price is maintaining strong momentum. Traders can expect a quick bounce back from this level and use this to make aggressive entries into the market.
This level represents a moderate retracement, indicating a healthy correction within the trend. It often acts as a significant support or resistance level. Traders often look for signs of consolidation or reversal at this level, making it a popular point for entering trades or adding to existing positions.
This is not actually a Fibonacci Level. However, the 50% level is widely used as it represents a substantial retracement, indicating a potential balance between buyers and sellers. This level is crucial for traders as it often signals a potential reversal point. Traders may consider this level for placing entry orders, setting stop losses, or taking partial profits.
This is known as the ‘golden ratio’, a strong retracement level that often indicates a deep correction within the trend. It is a key level where significant price reversals can occur. Traders typically watch this level closely for strong support or resistance. It is a favoured point for entering trades with tight stop-loss orders due to the high probability of a trend continuation.
This is the final level, which indicates a full retracement of the initial move. It suggests a potential end of the current trend and the possibility of a new trend beginning. Traders consider this level for major decision points. When the price reaches this level, it may signal a reversal or a continuation of a new trend. Traders can see this as a signal to re-evaluate their positions.
Fibonacci is relevant to financial markets as it offers traders a mathematical framework to analyse price movements and identify potential reversal levels. The Fibonacci sequence (0, 1, 1, 2, 3, 5, 8, 13, 21, etc.) and its ratios (such as 38.2%, 50%, and 61.8%) are widely used in technical analysis, particularly to identify potential support and resistance levels in price charts.
It is historically perceived that these levels represent key psychological points where price trends may reverse or continue. For example, if a stock price is in an uptrend and then retraces, traders might use Fibonacci retracement levels to gauge where the price could find support and potentially resume its upward movement. Similarly, in downtrends, Fibonacci levels can indicate potential resistance points where prices might struggle to move higher. Fibonacci analysis provides a systematic approach to identifying strategic entry and exit points, managing risks, and enhancing decision-making in the financial markets.
Fibonacci Extension is a popular technical analysis tool for predicting potential support and resistance levels beyond the standard Fibonacci retracement levels. These extensions are derived from the Fibonacci sequence and are used to forecast price movements by identifying possible target levels during strong trending markets.
Traders often apply Fibonacci Extension levels such as 127.2%, 161.8%, and 261.8% to determine where a price may extend after a retracement, providing crucial insights for setting profit targets and stop-loss levels. For example, if a stock retraces to the 61.8% Fibonacci level and resumes its upward trend, traders might look at the 161.8% extension as a potential target for taking profits.
Fibonacci retracements are essential tools in the world of financial trading. These levels, derived from the Fibonacci sequence and its key ratios, are instrumental in identifying potential support and resistance zones in price movements. The adaptability of Fibonacci levels across various assets and timeframes enhances their utility and makes them relevant for both short-term and long-term trading strategies. Understanding and leveraging Fibonacci retracement levels can significantly enhance traders' analytical capabilities and strategic decision-making, thereby providing a structured and effective approach to navigating financial markets.
Calculate your Net P&L after deducting all the charges like Tax, Brokerage, etc.
Find your required margin.
Calculate the average price you paid for a stock and determine your total cost.
Estimate your investment growth. Calculate potential returns on one-time investments.
Forecast your investment returns. Understand potential growth with regular contributions.

You have successfully submitted your partnership request form. You will be hearing us soon!