29 Jul, 2025
 6 mins read
In technical analysis, chart patterns play a key role in predicting future market movements. One such formation is the bear flag pattern, widely known for signalling the continuation of a downtrend. This bearish continuation pattern often appears after a sharp price fall and serves as an early warning that more downside could follow.
The bear flag chart pattern gained visibility during major market downturns. For example, during the 2008 financial crisis and the 2020 COVID-19 crash, many traders spotted bear flag formations as markets briefly recovered before falling further. Similarly, during the dot-com bubble burst in 2000, this pattern helped analysts anticipate extended declines in tech stocks.
Understanding the bear flag can help traders navigate uncertain times with more confidence. Let us break down what the pattern means, how to spot it, how to use it in trades, and its pros and cons.
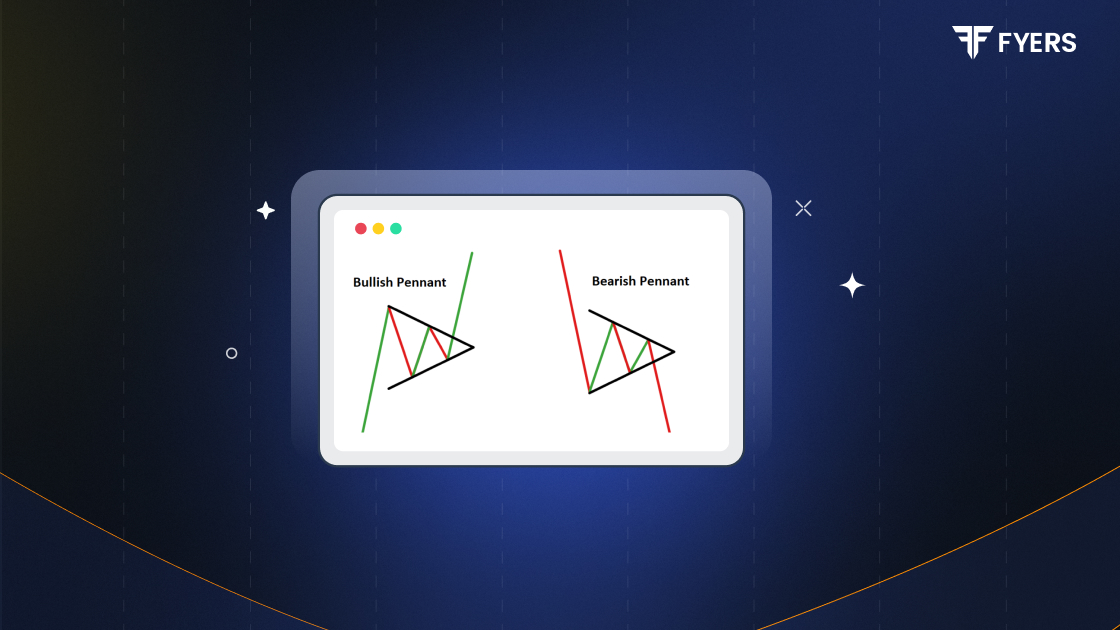
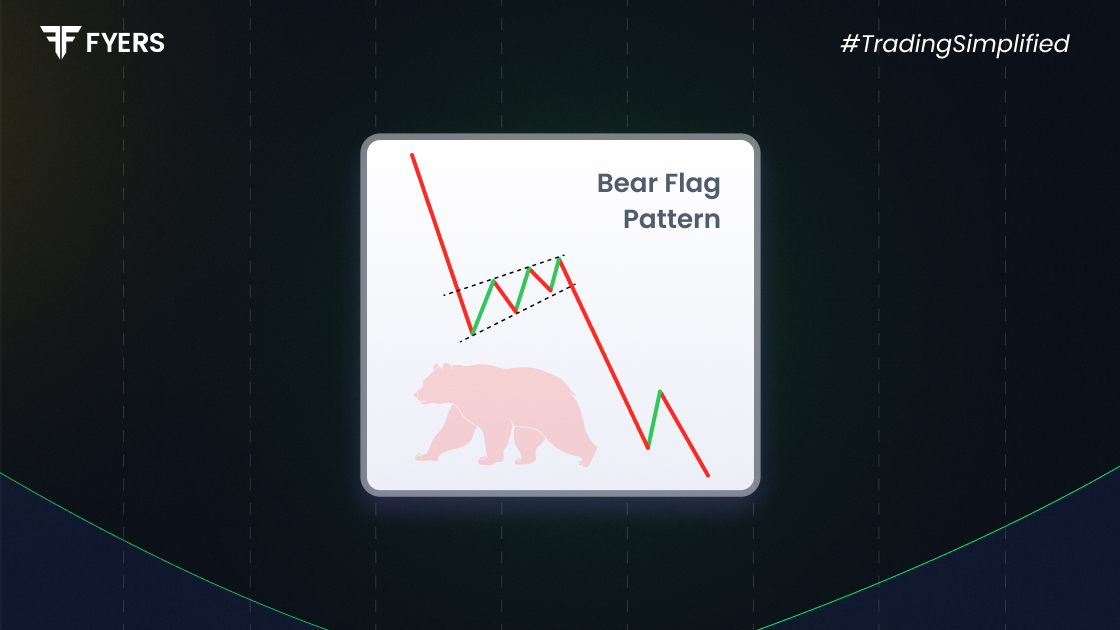
A bear flag candle pattern is a short-term consolidation phase that takes place after a strong downward price movement. The name comes from its visual appearance – a steep drop (the flagpole) followed by a narrow upward or sideways channel (the flag).
This formation reflects a temporary pause in the downtrend. Prices inch upwards or move sideways in a tight range, giving the illusion of recovery. However, this is often short-lived. Once the pattern completes, the price usually breaks down again, continuing the earlier fall. This is why it is considered a bearish continuation pattern – it signals that the downward trend is likely to resume soon.
The bear flag pattern suggests that the market is taking a short break after a strong sell-off. This brief recovery could be due to short covering or limited buying by bargain hunters. However, the buying strength is not enough to reverse the overall trend.
When the price breaks below the lower boundary of the flag with a noticeable rise in volume, it is seen as a confirmation of the bearish breakout. At this point, many traders take it as a signal to enter short positions or sell existing holdings. This breakdown usually leads to another leg down, often as big as the initial fall.
In short, a bear flag breakout signals that the bears are still in control and that further losses could be on the horizon.
Recognising the bear flag chart pattern can be quite straightforward if you follow these key steps:
Sharp Decline (Flagpole): The pattern begins with a steep and quick drop in price. This creates the pole of the flag and shows strong selling pressure.
Consolidation Phase (Flag): After the initial fall, the price moves slightly upwards or sideways in a tight channel. This forms the actual flag.
Decreasing Volume: During the flag formation, volume often drops. This signals a pause in selling activity, but not a reversal.
Breakout Confirmation: A clear breakdown below the flag’s support line, ideally with increasing volume, confirms the pattern. This is when traders expect the next downward move to begin.
Although this pattern is mostly used on intraday and short-term charts, it can also appear on daily or even weekly charts, especially during major market downtrends.
Using the bear flag chart pattern in trading involves a few simple but important steps:
Identify the Pattern: Look for a clear drop in price followed by a tight, upward-sloping or sideways channel. The pattern should be well-formed and not too long.
Set Entry Point: Traders typically enter a short position when the price breaks below the lower line of the flag. This is seen as the point where the downtrend resumes.
Set Target Price: To estimate the potential price movement, measure the length of the flagpole and subtract it from the breakout point. This gives you a rough idea of how far the price might fall.
Set Stop-Loss: A stop-loss is placed just above the upper line of the flag. This helps limit losses if the breakout turns out to be false and the price moves upwards instead.
Traders often use the bear flag in combination with other tools, such as moving averages, the Relative Strength Index (RSI), or volume analysis. These indicators add more confidence to the trade setup.
Early Signal: The bear flag candle pattern can provide early signals for traders looking to ride the continuation of a downtrend. It helps them plan entries ahead of the next big move.
Defined Entry and Exit: This pattern offers clear levels for placing entries, targets, and stop-losses. That makes trade planning easier and more disciplined.
Works Across Timeframes: The bear flag works well on multiple timeframes. Intraday traders can spot it on hourly or 15-minute charts, while swing traders can use it on daily or weekly charts.
False Breakouts: Like all chart patterns, the bear flag is not foolproof. Sometimes the price breaks out briefly but then reverses, trapping traders in losing positions.
Volume Dependency: A valid bear flag breakout often needs a surge in volume. If volume is low, the signal may not be reliable, making it harder to trust.
Needs Confirmation: This pattern is not meant to be used alone. Traders must combine it with other technical indicators or market analysis to confirm its reliability.
The bear flag pattern is a powerful tool in a trader’s technical analysis toolkit. It helps identify short-term opportunities to profit during extended downtrends. Over the years, traders have used it to navigate sharp market corrections, including the 2008 crash and the early 2020 COVID-19 sell-off. In both cases, bear flags appeared frequently before the next wave of selling.
However, it is important to remember that no chart pattern is perfect. The bear flag candle pattern should be used alongside technical indicators, broader market analysis, and solid risk management strategies. Traders should always confirm signals and avoid relying solely on one pattern.
In the right conditions, the bear flag can offer high-probability trades with well-defined risks. With practice and patience, it can become a reliable part of your trading approach.
A bear flag is a short pause after a sharp drop in price, where prices rise slightly within a narrow range before falling again.
A bear flag breakout is confirmed when the price drops below the lower line of the flag with rising volume.
Bear flag patterns work best on intraday or short-term daily charts, but they can also be seen on longer timeframes during major downtrends.
Calculate your Net P&L after deducting all the charges like Tax, Brokerage, etc.
Find your required margin.
Calculate the average price you paid for a stock and determine your total cost.
Estimate your investment growth. Calculate potential returns on one-time investments.
Forecast your investment returns. Understand potential growth with regular contributions.

You have successfully submitted your partnership request form. You will be hearing us soon!