Hi Jigar Singh, could you please elaborate on your concern so that I can assist you accordingly?
Chart
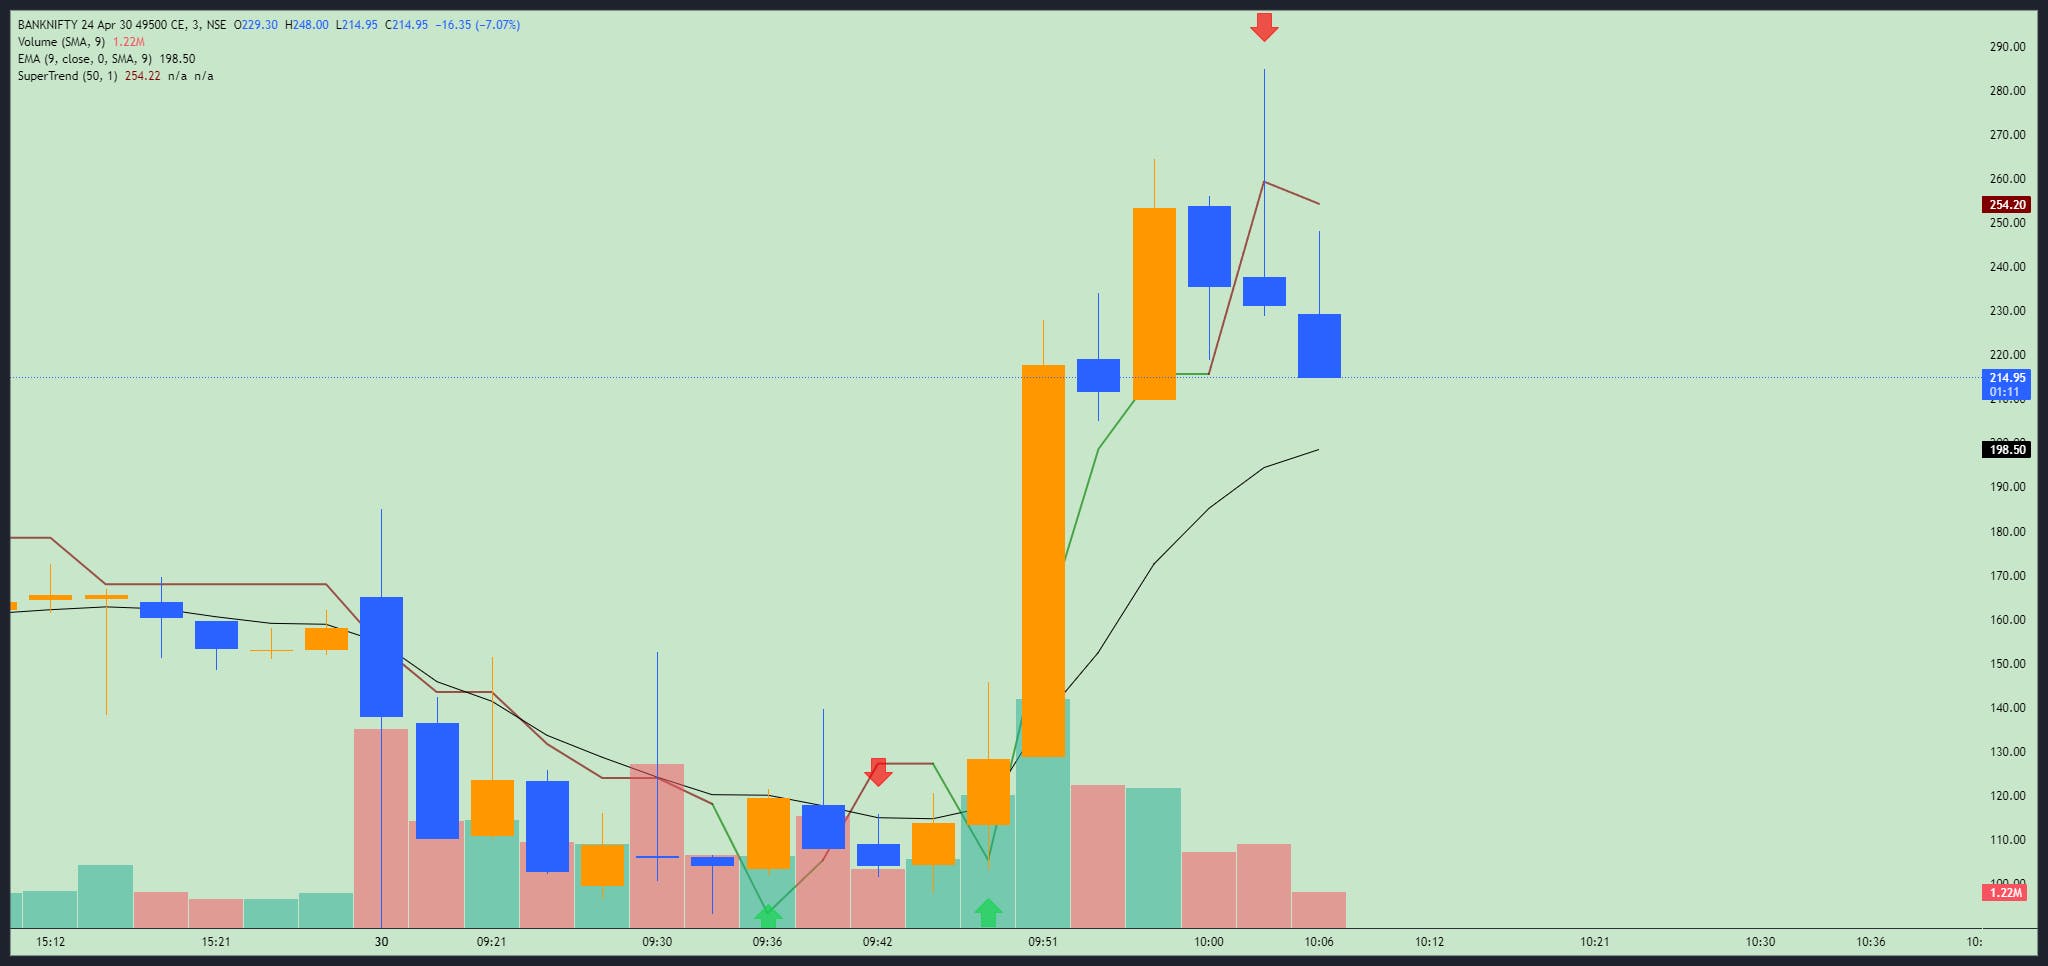
Chart me super ka sell dekho kaha pe aaya hai,
Jis candle me sell dikha raha h wo candle actual me super trend ke upar hi close huyi h, jo running candle h wo super trend ko niche break kar rahi to logically last candle pe signal aana chahiye,
Is chart ko mai 2,3 baar refresh bhi kiya but wo same dikha raha hai,
Aesa Q ho raha h yahi Question hai mera,
Or aaj kal glitches bhi jyada hi aa rahe h FYERS me,
Salary ni mil rahi employee ko?

It is working correctly. If you extrapolate the SuperTrend line on that second last candle where Fyers SuperTrend is showing Sell Signal, it has closed below the projected ATR X multiplier line (SuperTrend) see below picture.
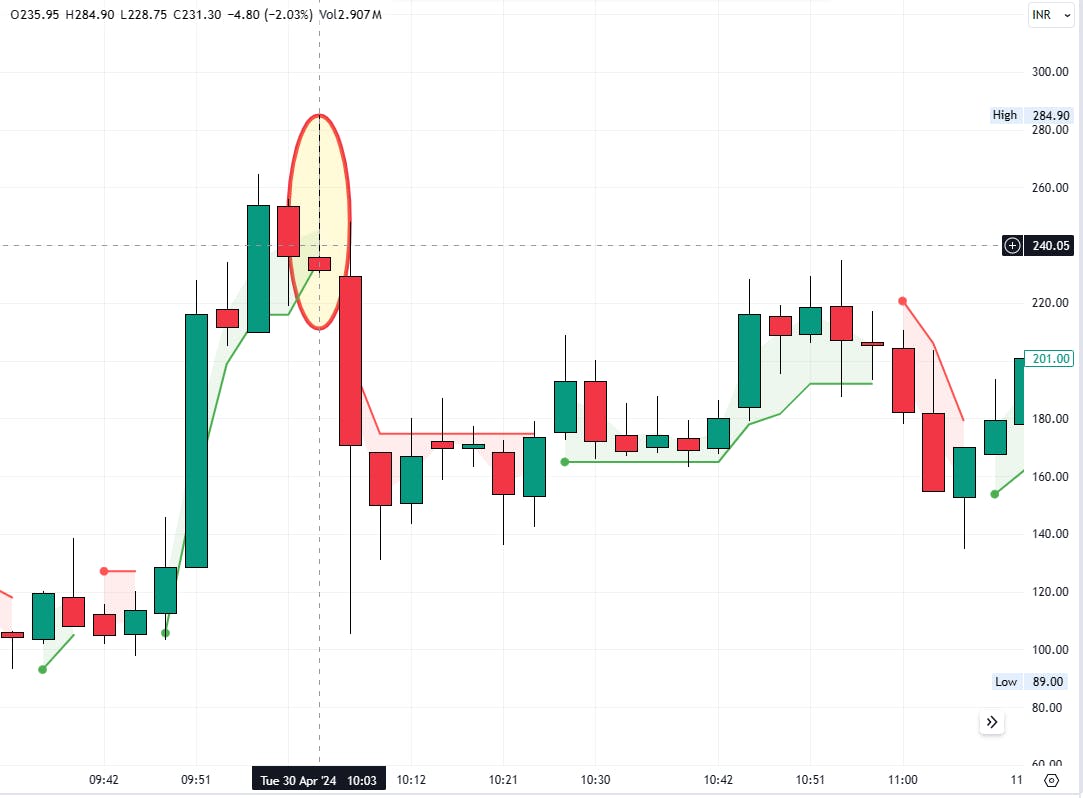
It is inappropriate to compare current candle close with SuperTrend line of previous candle. SuperTrend as per default TradingView library is calculated based on current projection of ATR period X multiplier line with current candle HL2.
Trapp for Option Seller
Aap mera or apna chart dekho difference h,
Aapke chart me 10.03 wali candle ko green super trend touch kar raha h ,
Wahi mere chart me red super trend touch kar raha hai ,
Ye niche wala dekho is , 10.06 pe super trend ka sell signal aaya hai,
Same aesa hi super trend 1st chart me v check kar sakte ho aap
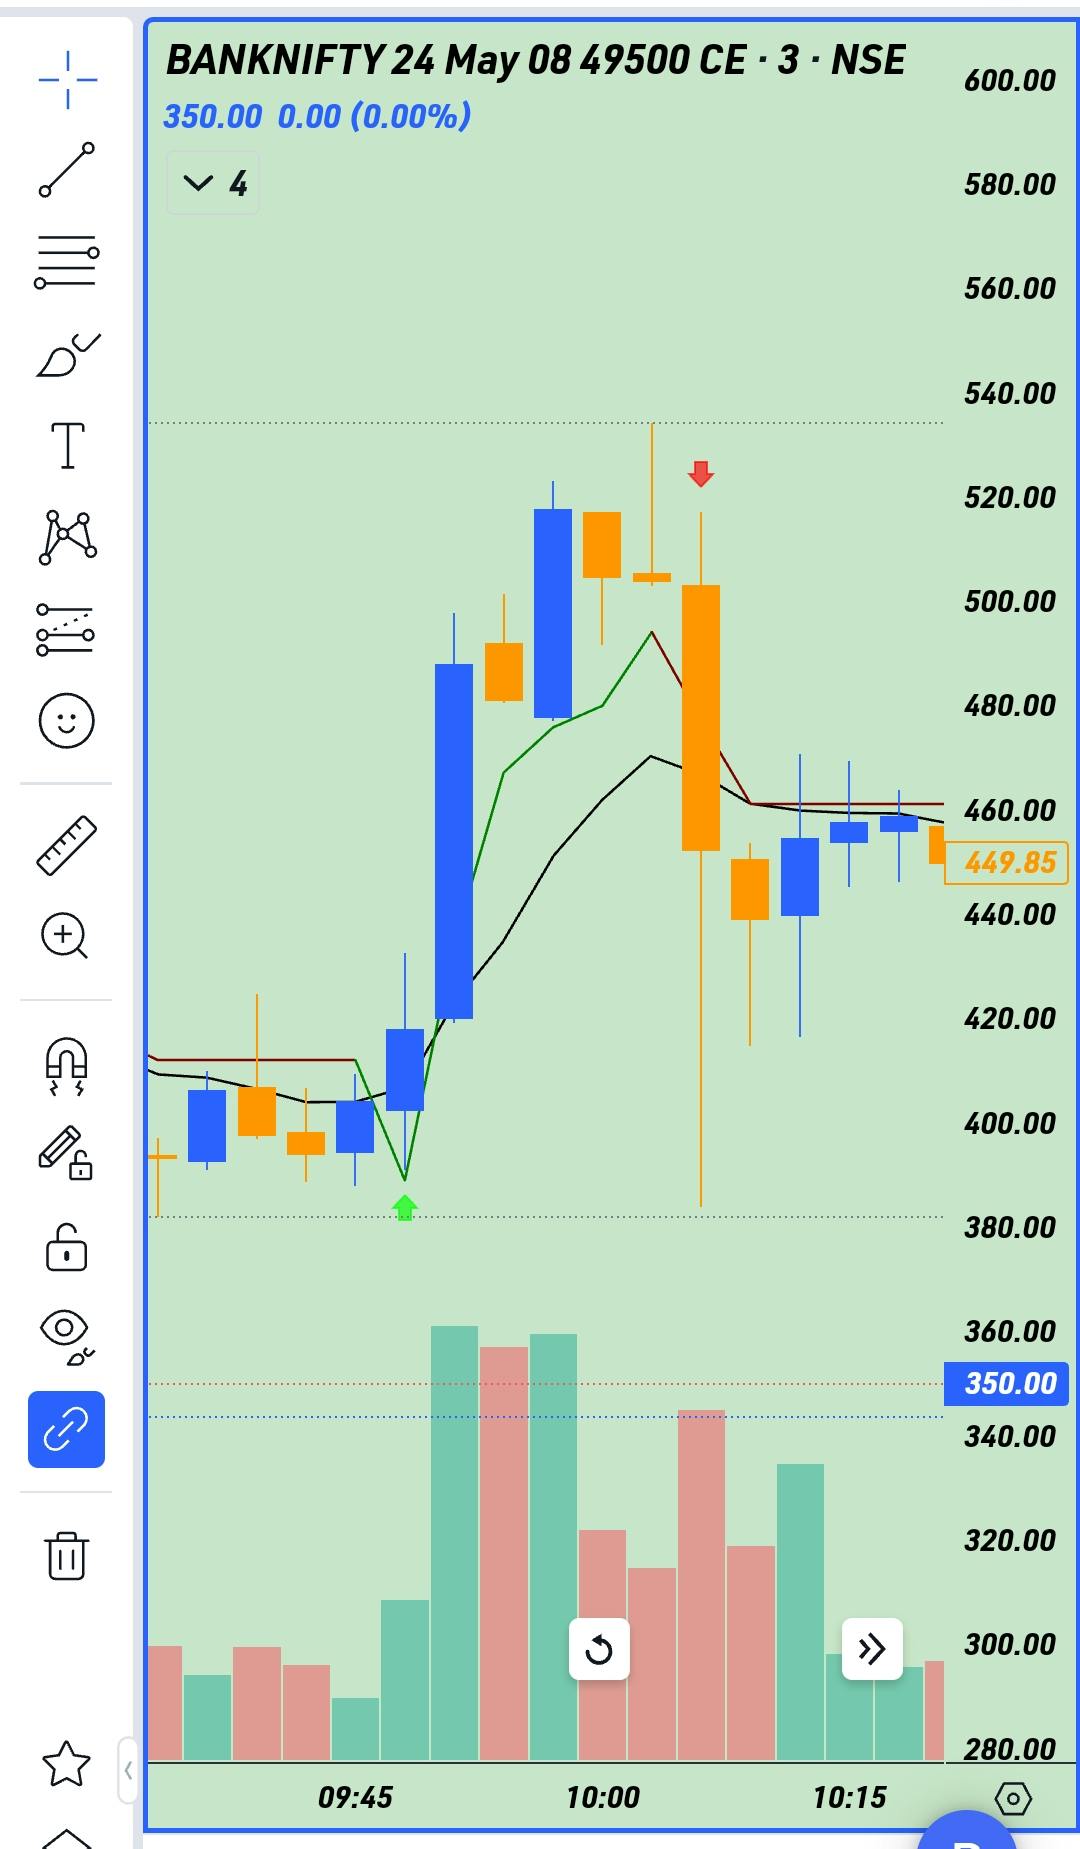
Originally posted chart was of 30 Apr expiry trading around 240 Rs. This one you are referring now is of different (08 May) expiry.
Green SuperTrend touching the 10:03 candle in my chart is to show the projected SuperTrend and not real SuperTrend. That is custom indicator I have plotted to show the difference that the close was below the projected SuperTrend. And so there was Sell Signal on 10:03 candle itself in Fyers Chart which is correct.