What is the right way of drawing the Fibonacci retracement?
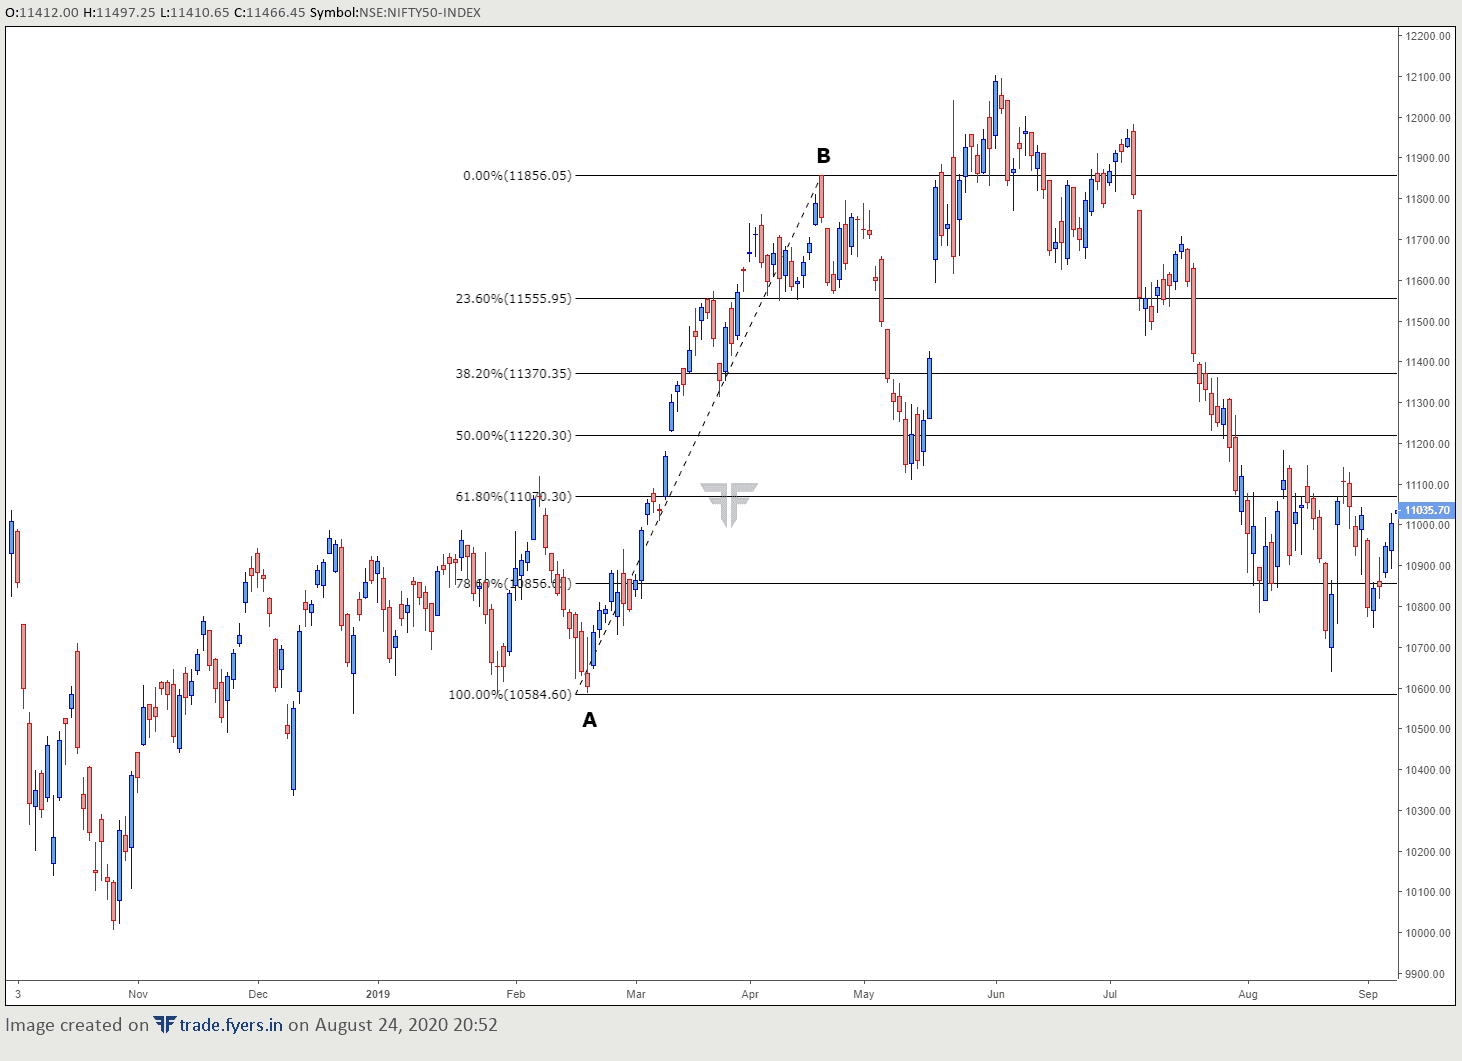
Let me explain this by taking the case of how to draw a Fibonacci retracement following a rally in price. In order to draw a retracement following a rally to see the potential supports, you need to identify two things on the chart: an important low and an important high. Once these two points are identified, click on the Fib retracement tool. Then connect the low with the high. The tool then plots various Fibonacci retracement levels. In an uptrend, each Fibonacci retracement acts as a support. 61.8% retracement is a key retracement ratio to keep an eye on. If price falls below the 61.8% retracement, it means the uptrend has weakened quite a bit.
The opposite is also true when drawing a Fibonacci retracement following a decline in price.
See the chart below. Notice the two points marked as A (low) and B (high). After the high that was made at Pt.B, price started correcting. If i now want to calculate possible support levels, all I have to do is click on the Fibonacci retracement tool and connect the low with the high. As can be seen in the chart, price took support near 61.8% retracement, before continuing its up move.
3 Likes
so basically it says the halts in trend and we need to draw from low to high in down trend and vice versa ?
No , you draw it from low to high in an uptrend to see how much it will or it has retraced back from its latest high and vice versa. The numbers indicate how much the price has retraced. 0 means no retracement and 1 means 100% retraced back.
I have two questions?
-
Is not about drawing from recent low to recent high?
-
What time frames should be used? Does it work in the lower time frames too?
Thanks a lot for your answer.
Personally I don’t like Fib Retracement, but here is the right method,
- To draw Fib ret, you need to find the last trend of the stock and from where it started
- Look Left, Identify a Lowest Point from where the Stock started making HH and HL;
- Identify a Highest Point from where the stock started making LH and LL
- In First case, the lowest point from which the stock started making HH and HLs is your point you should start stretching the fib levels. Your dropping point should be the point in a trend from which the stock started making LH and LLs.
- Vice versa for Bottom to Top
attaching an image for ur reference.
regards
mvp
