Every Futures and Options contract is built around an underlying. As the underlying moves, the contract responds, but not always in the same way.
Contracts based on the same underlying can behave differently because of their expiry, market participation, implied volatility, and other contract-specific characteristics. Understanding this relationship is an important part of analysing derivatives.
That’s why we built Symbol Details for Futures and Options on FYERS. It helps you understand both the contract and its underlying through a connected view of price action, contract information, derivatives analytics, strategies, and technical analysis, making it easier to understand the opportunity before deciding what to explore next.
Start with the Overview
The Overview brings together the information you may want to check first before studying a Futures or Options contract in greater detail.
Depending on whether you’ve opened a Futures or an Options contract, some sections may vary to display information that’s relevant to that contract.
Analyse Contract Price Movement with Price Chart and Price Analysis
The Price Chart shows how the selected contract has moved during the trading session. Along with the current price and daily change, you can switch between different periods to see whether the movement is limited to the current session or part of a broader trend.
A technical observation may also appear above the chart, highlighting a relevant development in the contract. When you want to study the setup in greater detail, you can open the complete chart directly from this section.
Price Analysis complements the chart by placing the current contract price within its trading range across different periods. The supporting Price Stats provide information such as the day’s open, high, low, previous close, volume, VWAP, and the 52-week range.
For Options contracts, the corresponding details of the underlying are also available, making it easier to understand how movements in the underlying are reflected in the option premium.
Understand Market Participation with OI & Other Details
For Futures contracts, OI & Other Details brings together information that helps you understand how market participation is changing.
Review Open Interest, Change in Open Interest, percentage change in Open Interest, and the premium or discount to the underlying alongside the contract price to better understand trading activity.
Review Contract Information with Contract Details
Every Futures and Options contract comes with information that helps explain how it behaves.
For Futures, Contract Details includes information such as the expiry date, lot size, and other contract specifications.
For Options, you’ll find the relevant contract information alongside the option-specific sections available for that contract.
Understanding these details helps you evaluate the selected contract before moving further into your analysis.

Compare Contracts with Future Chain
The same underlying is often available across multiple futures expiries.
The Future Chain lets you compare contracts through their price, Open Interest, Change in Open Interest, volume, and premium or discount to the underlying, making it easier to understand how activity changes across expiries before opening a specific contract.

Analyse Derivatives Activity with Option Analytics
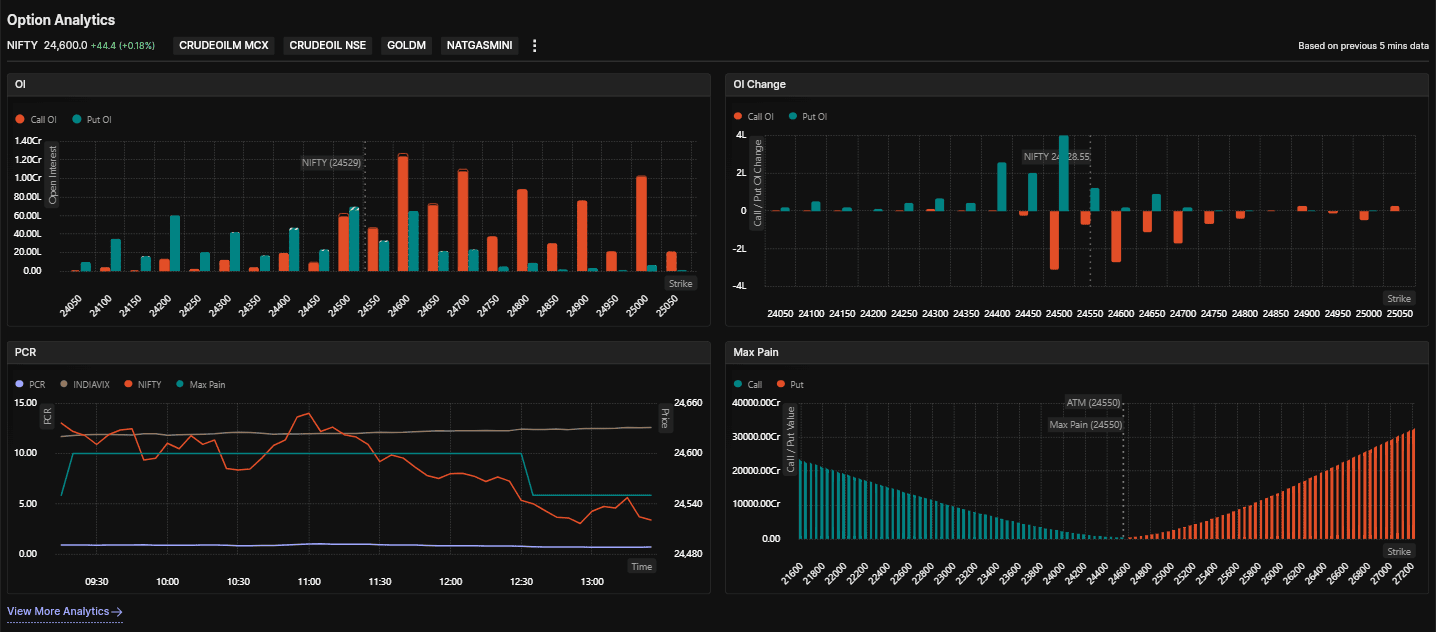
For contracts with an active options market, Option Analytics provides a broader view of derivatives activity around the underlying.
Study Open Interest, Change in Open Interest, Put-Call Ratio (PCR), and Max Pain together to better understand how positions are building across the options market.
Explore Trading Ideas with Strategies
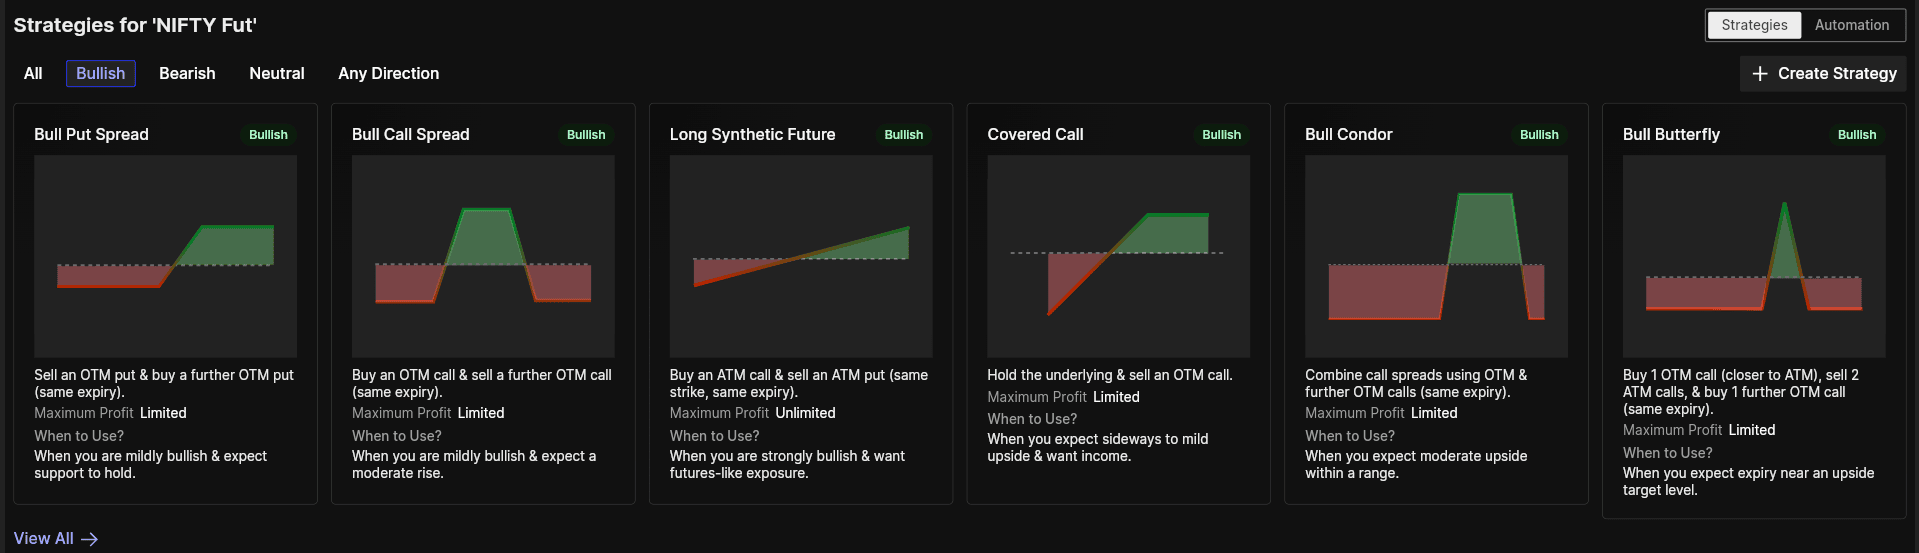
Once you’ve formed a market view, the Strategies section helps you explore predefined options strategies that align with it.
Browse strategies under Bullish, Bearish, Neutral, and Any Direction. Each strategy includes a payoff diagram and a brief explanation, helping you understand how it works before continuing to Strategy Builder or Automate.
Analyse Historical Trends with Seasonality Chart
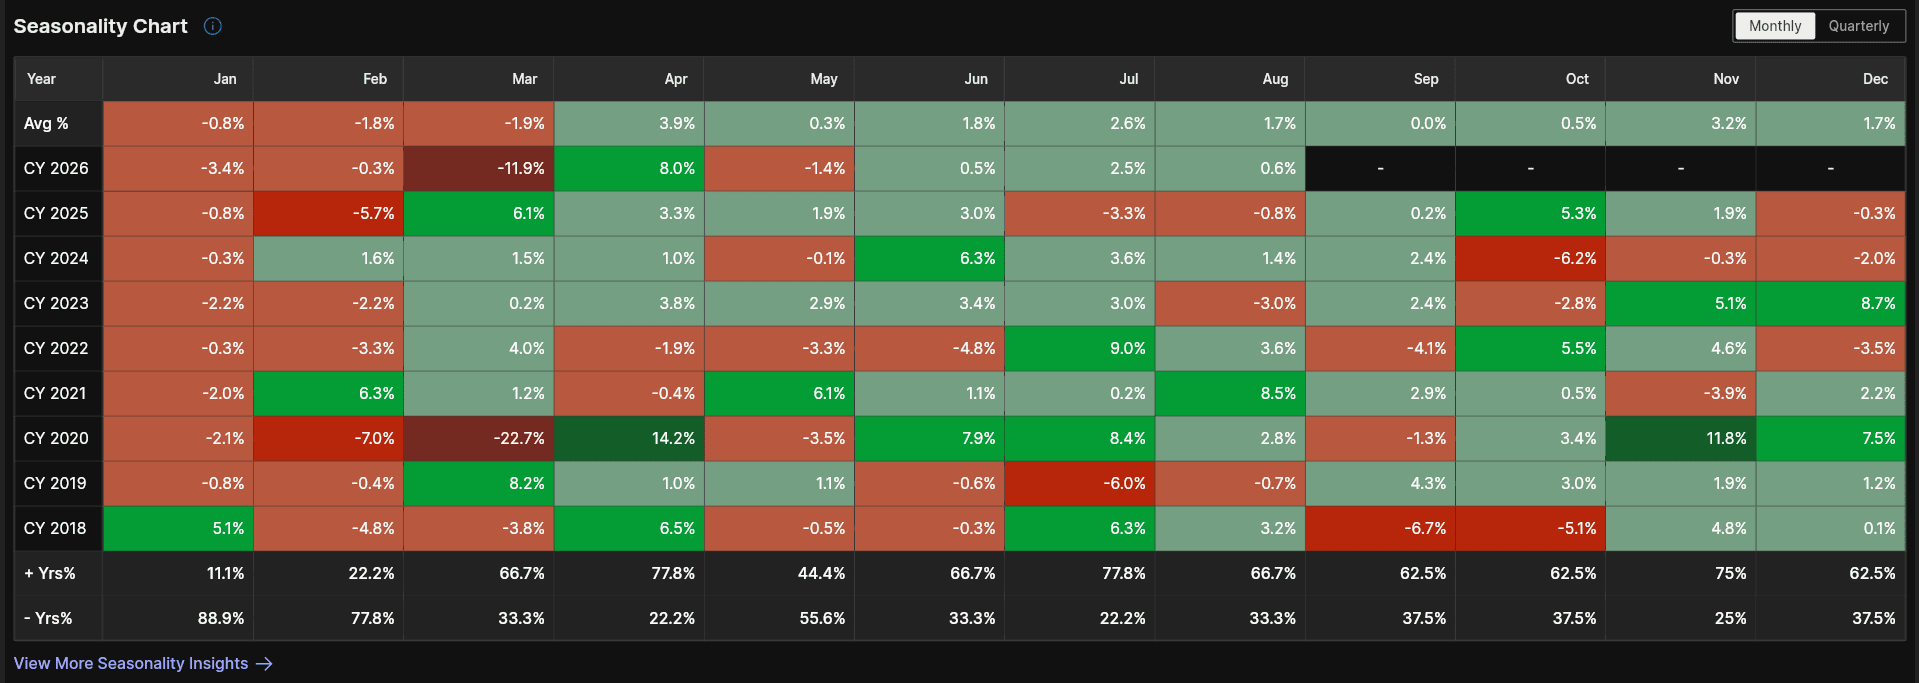
Markets can exhibit recurring patterns over time.
The Seasonality Chart shows how the underlying has historically performed across different months and quarters. Compare average returns, review historical performance across years, and see how often the period ended positively or negatively.
These patterns are based on historical performance and do not predict future returns. For a more detailed view, continue to Seasonality Insights.
Continue Your Analysis with Tools
The Tools section helps you continue your workflow.
Depending on the selected contract, you can open the Option Chain, launch Scalper, continue to Strategy Builder, or move to the F&O Dashboard.

Continue with Technical Analysis
When the Overview is not enough, the dedicated technical sections let you study the selected contract in greater detail.
Analyse Contract Trends with Charts
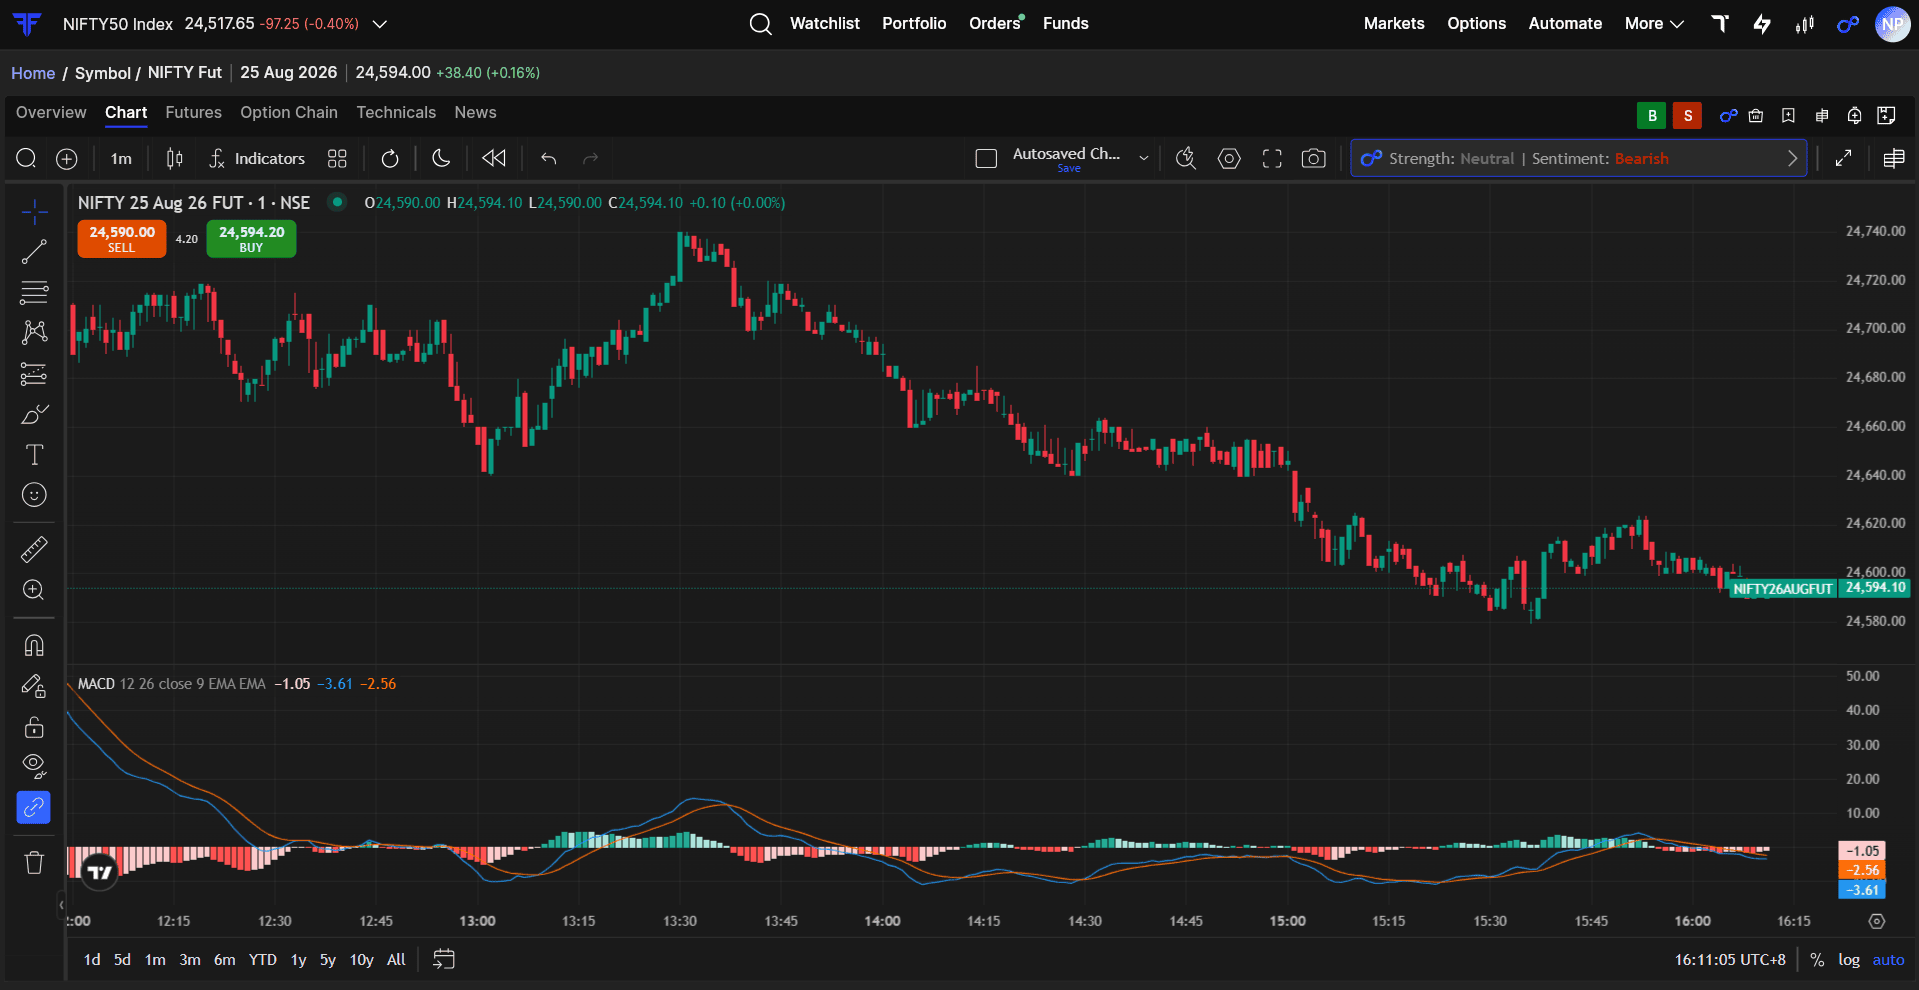
The Charts section provides the complete charting experience for the selected contract.
Study price movements across different timeframes, apply indicators, use drawing tools, and continue your technical analysis in greater detail.
Understand the chart with FIA
Need help reading this chart? Use FIA to understand price action, identify key trends, and get context behind market movements all without leaving the chart.
Study Technical Signals with Technicals
The Technicals section brings together technical indicators and market signals for the selected contract.
It provides another way to study trend, momentum, and important technical levels before returning to the chart for deeper analysis.
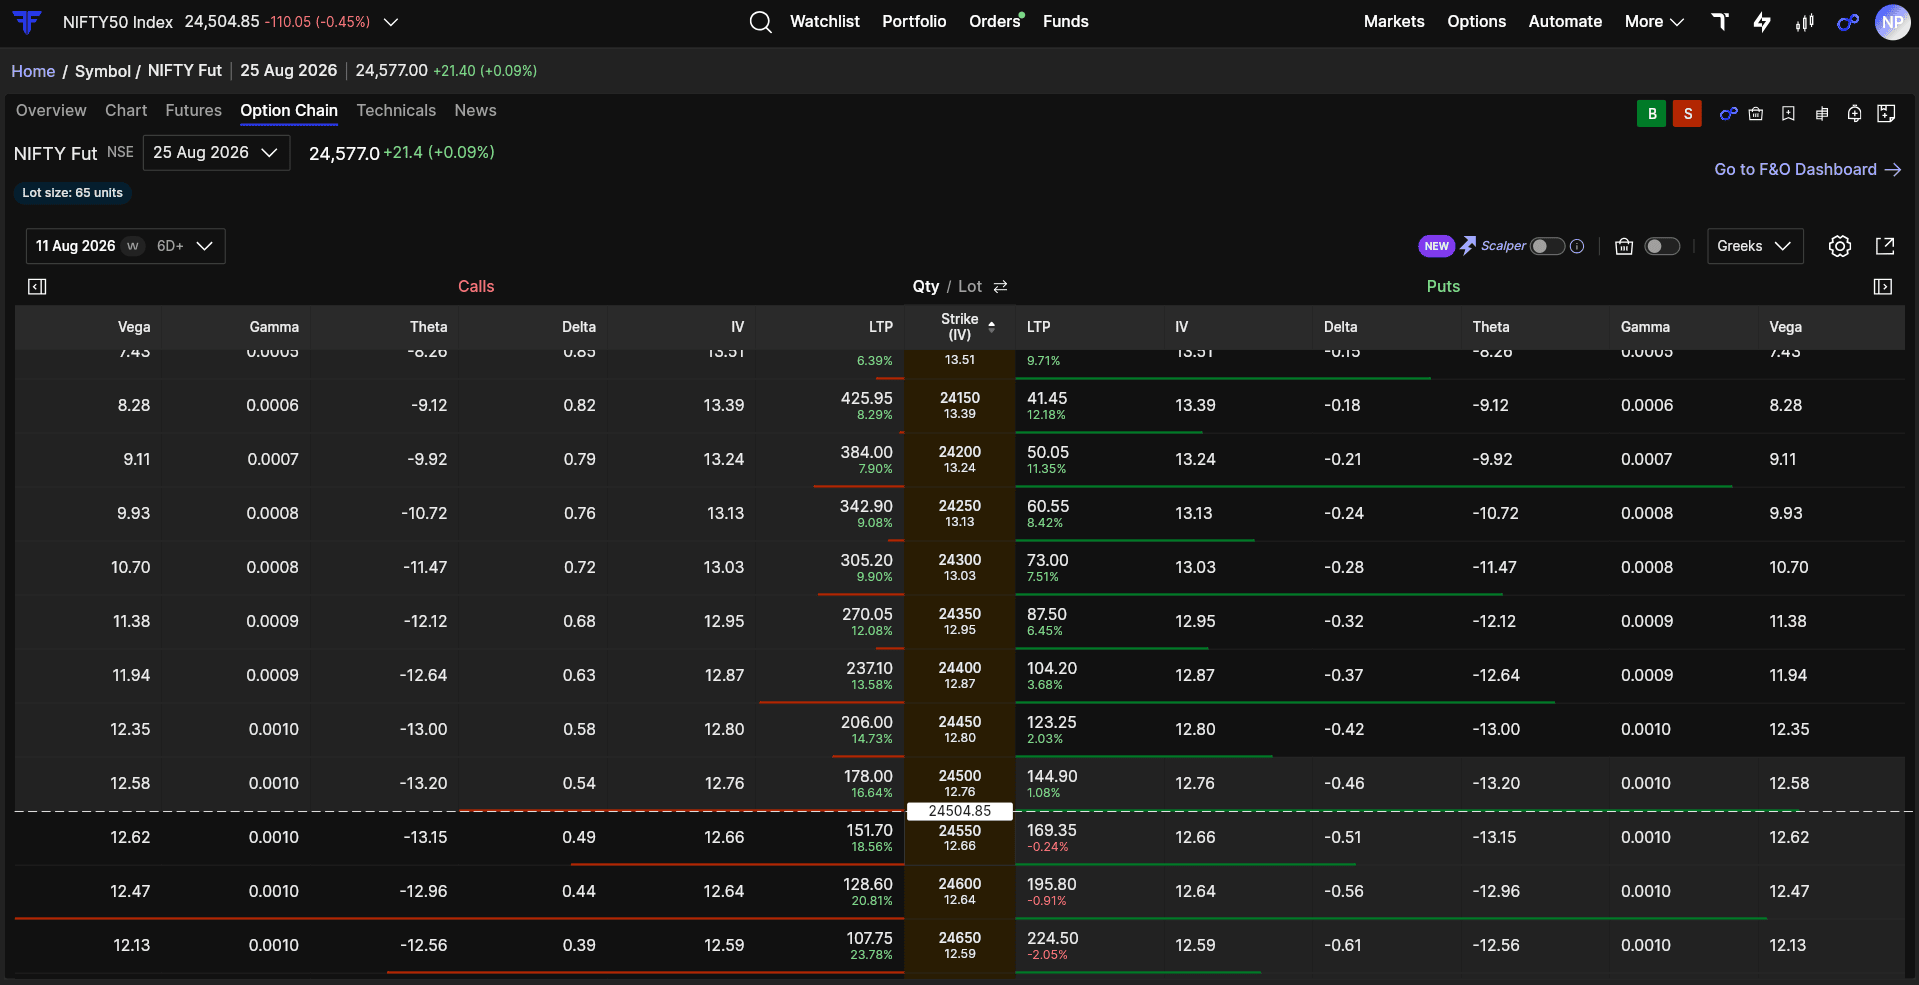
Explore Related Options with Option Chain
Analyse Options Contracts with Option Chain
The Option Chain lets you study Call and Put contracts across different strikes and expiries while staying connected to the selected underlying.
Compare premiums, Open Interest, and available contracts before continuing your analysis.
Follow Market Developments with News
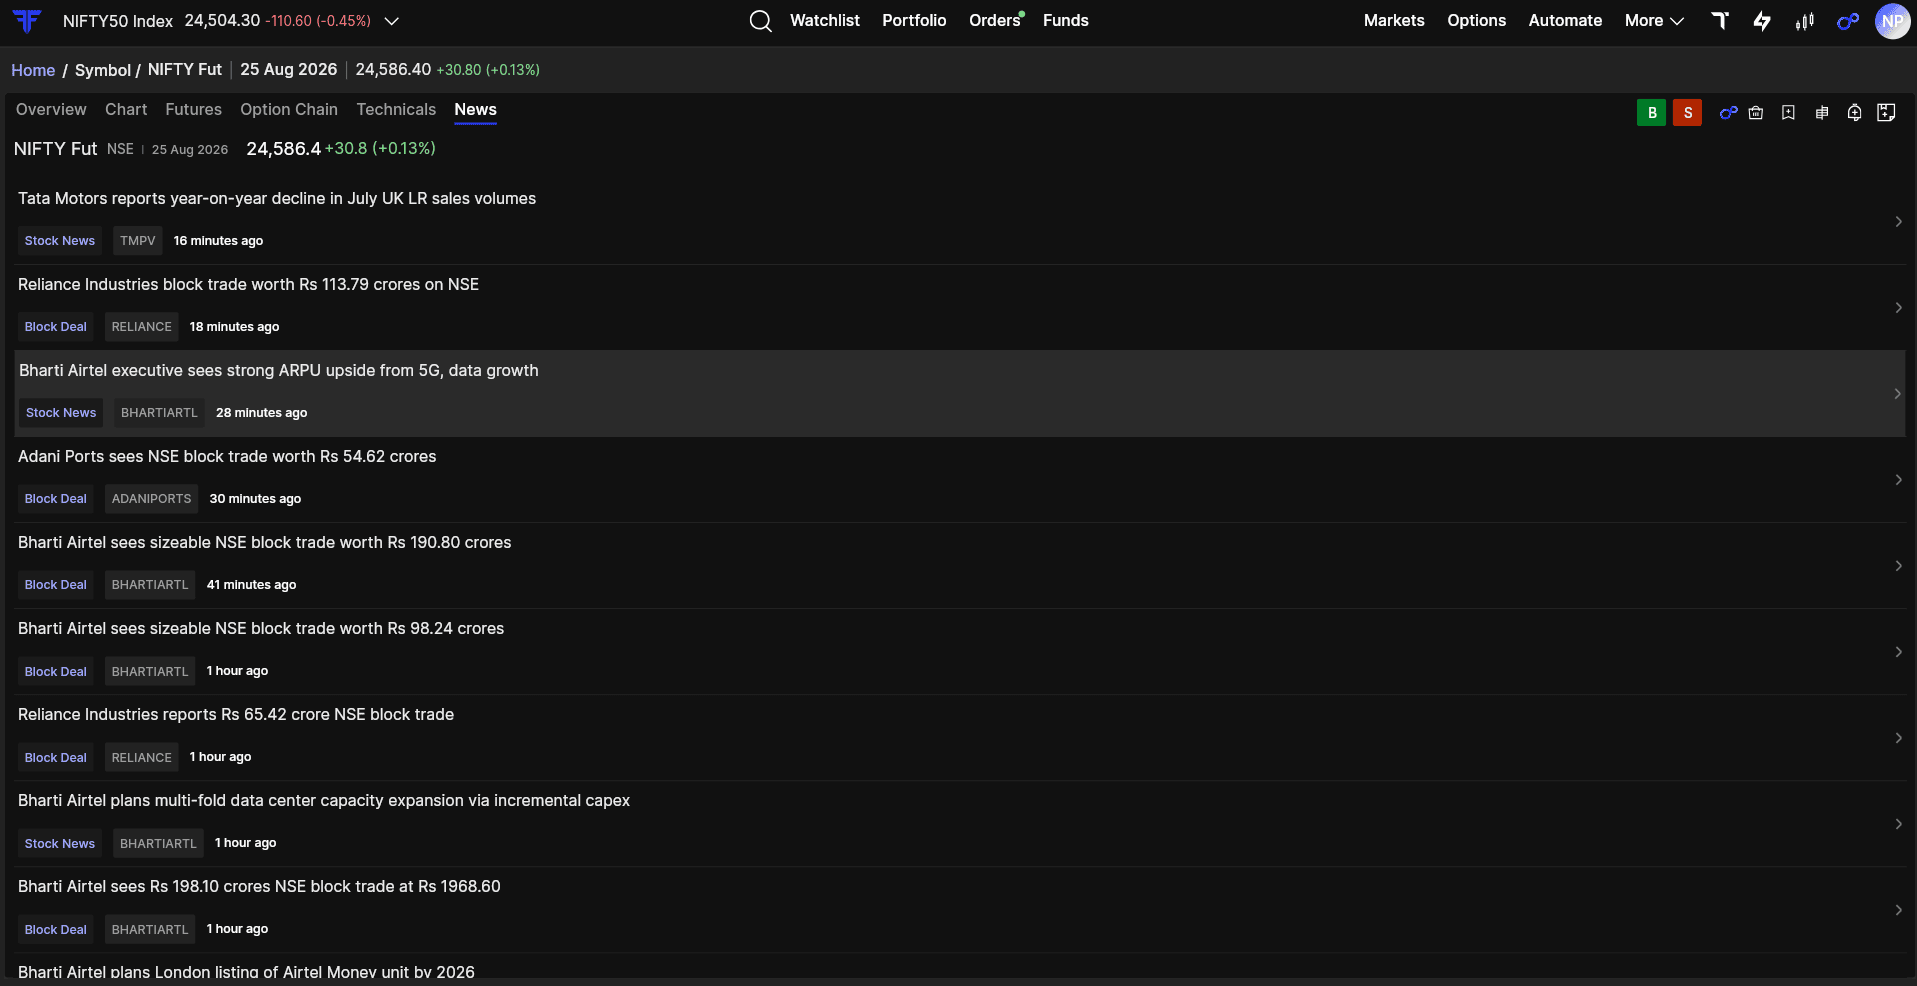
Stay Updated with News
Movements in a Futures or Options contract are often influenced by developments related to the underlying and the broader market.
The News section brings together recent updates that may be relevant while analysing the selected contract and its underlying.
Have questions about Symbol details? Check out the FAQ section.
Understand Every Contract with Greater Clarity
Every Futures and Options contract reflects more than its latest traded price. It represents the relationship between the underlying, market participation, volatility, and the characteristics unique to that contract.
With Symbol Details on FYERS, you can begin with the Overview, understand market participation through OI & Other Details, review Contract Details, analyse Option Greeks, compare contracts using Future Chain, study Option Analytics, continue into Charts and Technicals, explore the Option Chain, and stay updated with the latest News.
Search for any Futures or Options contract on FYERS Web or App and open Symbol Details to begin.