Every trading day starts with a question: what’s happening in the market today?
To answer that, you might first study the underlying market to understand its direction, then look at F&O activity to see how markets are positioned. Whether you’re analysing a stock or tracking a commodity, each piece of information helps you build a clearer view before taking a trade.
That’s why we’ve brought market information and analysis tools together on FYERS Home, helping you understand market movements better and make more informed trading decisions.
Start with the Bigger Picture with Overview
Start with Overview to get a snapshot of Indian and global indices, stocks, commodities, and ETFs. It helps you understand broader market activity before deciding where to focus.
Looking for stocks with upward momentum? Discover Opportunities is a good place to begin. Use ready-made Screeners to identify stocks matching predefined conditions, or try Smart Screeners to apply your own criteria.
Once you’ve found something worth exploring, check Seasonality Insights to study historical patterns. You can then use Market Analytics for further analysis and Quick Access to Charts to study price action and assess risk.
Learn More with Webinars and the Product Tutorials
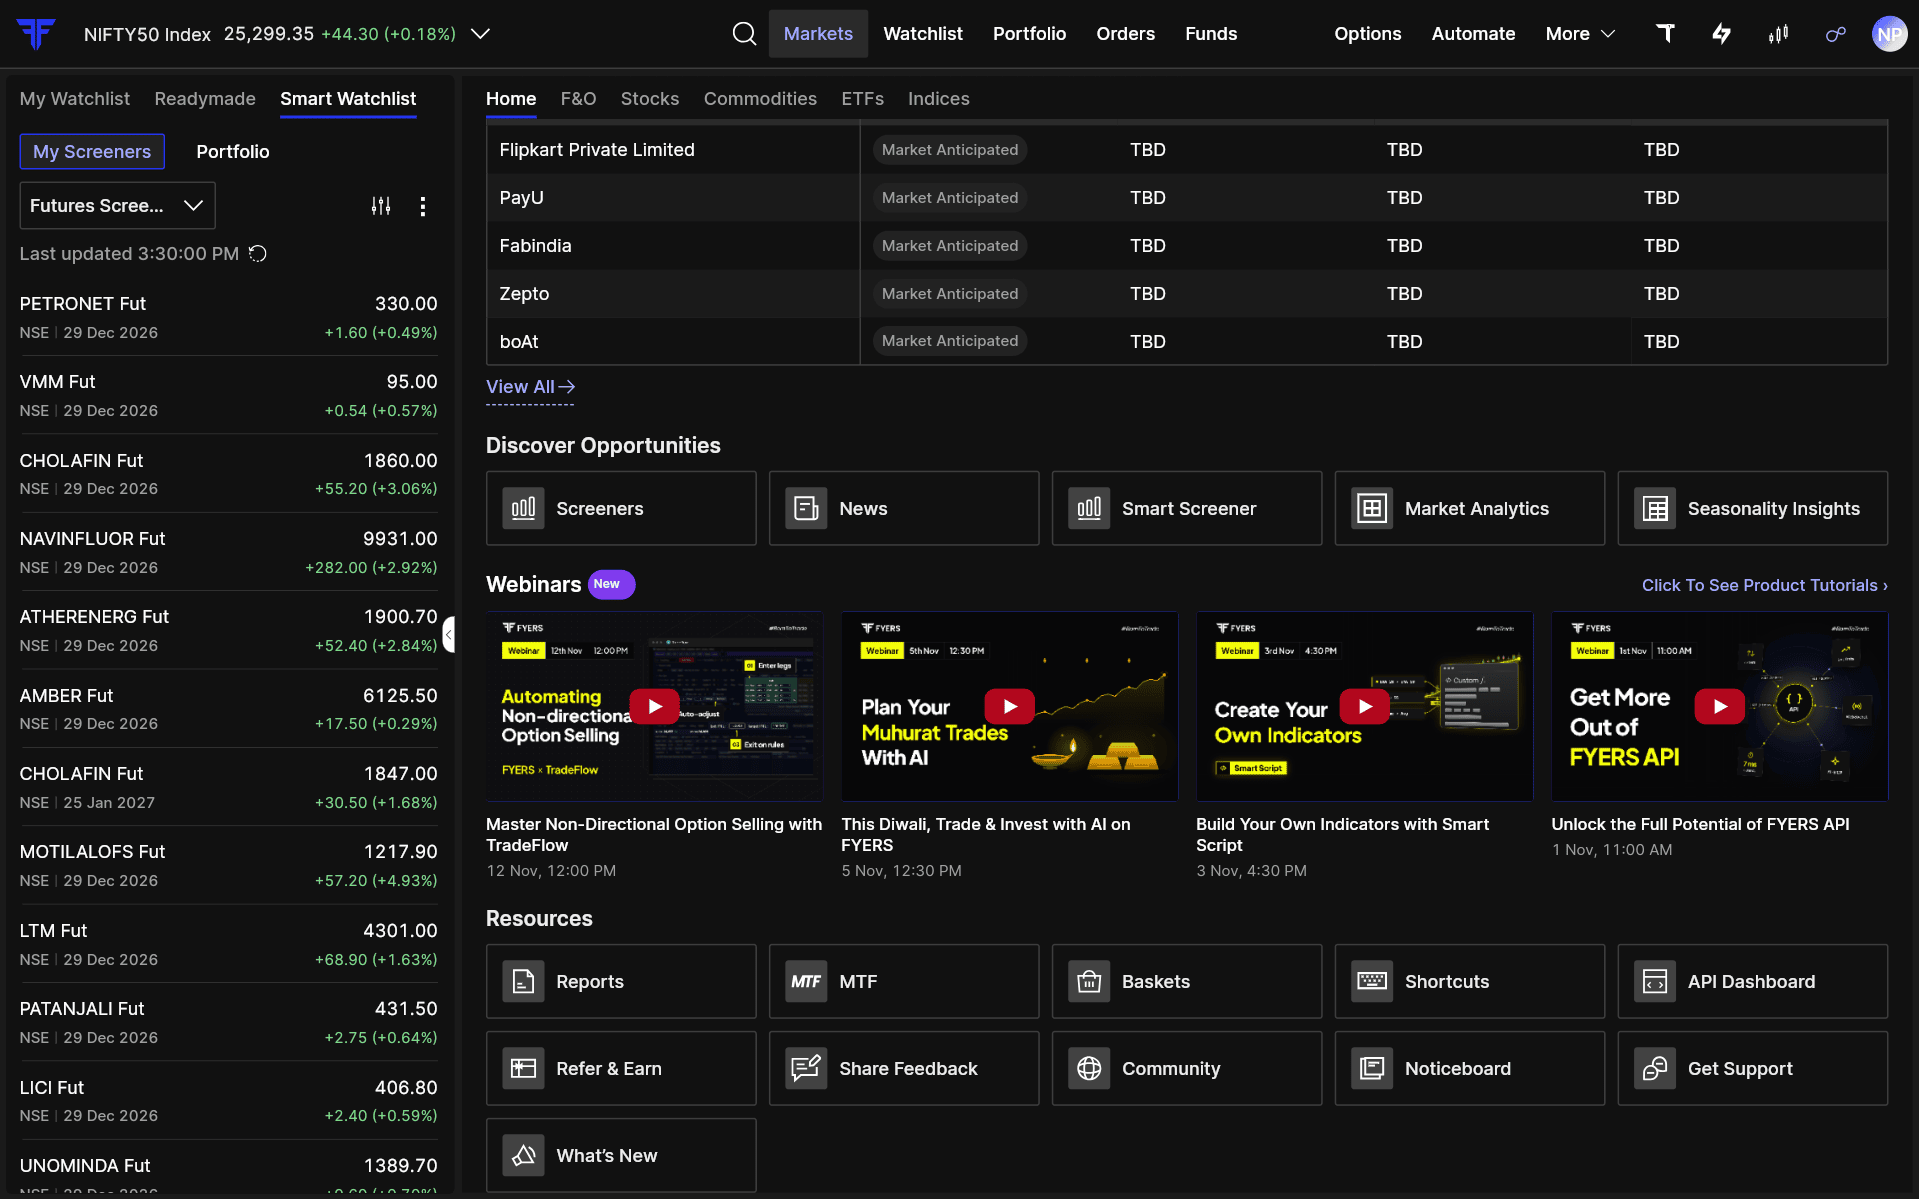
Knowing how to use the right tools is just as important as having access to them.
Want to learn more about trading concepts, market analysis, or FYERS products? Explore our webinars directly from Home and stay informed about upcoming sessions.
For guidance on FYERS products and features, head to the Product Tutorials. It helps you understand what each product does and how to use it.
Understand Market Positioning with F&O
If NIFTY is moving higher, you may want to understand whether derivatives activity supports that movement.
Head to the F&O tab to examine Open Interest, OI changes, PCR, and Max Pain. These data points help you understand where positions are building up.
You can also explore Strategies and review their payoff diagrams to evaluate potential risk and reward before considering a trade.
Look Deeper into Stock Activity
A stock gaining 4% during the session may catch your attention. But what’s driving the move? Start with Equity Movers in the Stocks tab to identify gainers, losers, and other active stocks.
From there, Heatmaps can help you see whether the strength extends across the market. You can also check Bulk and Block Deals for large transactions and Company Filings for announcements that may explain the movement.
Analyse Commodities and ETFs
Following Gold or Crude Oil? The Commodities tab lets you examine price movements, active futures contracts, and options activity. You can also explore Strategies based on your market outlook.
If you’re interested in ETFs, head to the ETFs tab to compare market movers and identify funds worth a closer look.
Understand What’s Driving the Broader Market
An index moving higher doesn’t always mean the entire market is strong.
Say NIFTY is up 0.8%. You may want to know whether the gains are spread across sectors or concentrated in a few stocks.
Start with Index Performance in the Indices tab to compare market movements. Heatmaps help you see where strength and weakness are concentrated, while FII & DII Activity adds context about institutional participation.
To get started, log in to FYERS. You’ll land directly on FYERS Home under Markets. For more information, refer to our Support articles.
Analyse More, Switch Less
Market analysis is about connecting the information that matters before making a decision. We’ve brought market data, screeners, analytics, charts, and strategies together on FYERS to make that process easier.
Explore FYERS Home and share your feedback in the comments.