New Indicators on FYERS Charts for Trend, Volume and Market Structure
Traders read charts in different ways. Some focus on trends, some look closely at volume and participation, while others rely more on price action and market structure.
As we continue building Smart Charts, our in-house charting platform, we keep receiving requests for indicators that support different styles of technical analysis. In the previous phase, we expanded the indicator library with another set of tools traders had been asking for.
Now, in Phase 6 of our indicator expansion, we are adding four more:
-
Smart Money Concepts (SMC)
-
Hull Suite
-
Negative Volume Index (NVI)
-
Positive Volume Index (PVI)
Each serves a different purpose. Smart Money Concepts helps traders identify key market structures, Hull Suite helps follow trend direction, NVI tracks price behaviour during lower-volume periods, while PVI focuses on price movements during higher-volume periods.
It is another step towards making FYERS Charts useful across different approaches to technical analysis.
Smart Money Concepts (SMC)
If market structure is part of your analysis, you may already spend time marking swing highs and lows, Order Blocks, Fair Value Gaps and other areas you want to track as price develops.
Smart Money Concepts automatically marks several commonly followed market structure concepts on the chart, including Breaks of Structure, Changes of Character, Order Blocks, Fair Value Gaps, Equal Highs and Lows, and Premium and Discount Zones.
The objective is not to treat every marked level as a trading signal. Instead, it gives you a structured view of price action without having to identify and redraw these areas manually.
To understand what each SMC component represents and how they can be interpreted together, refer to our detailed SMC blog.

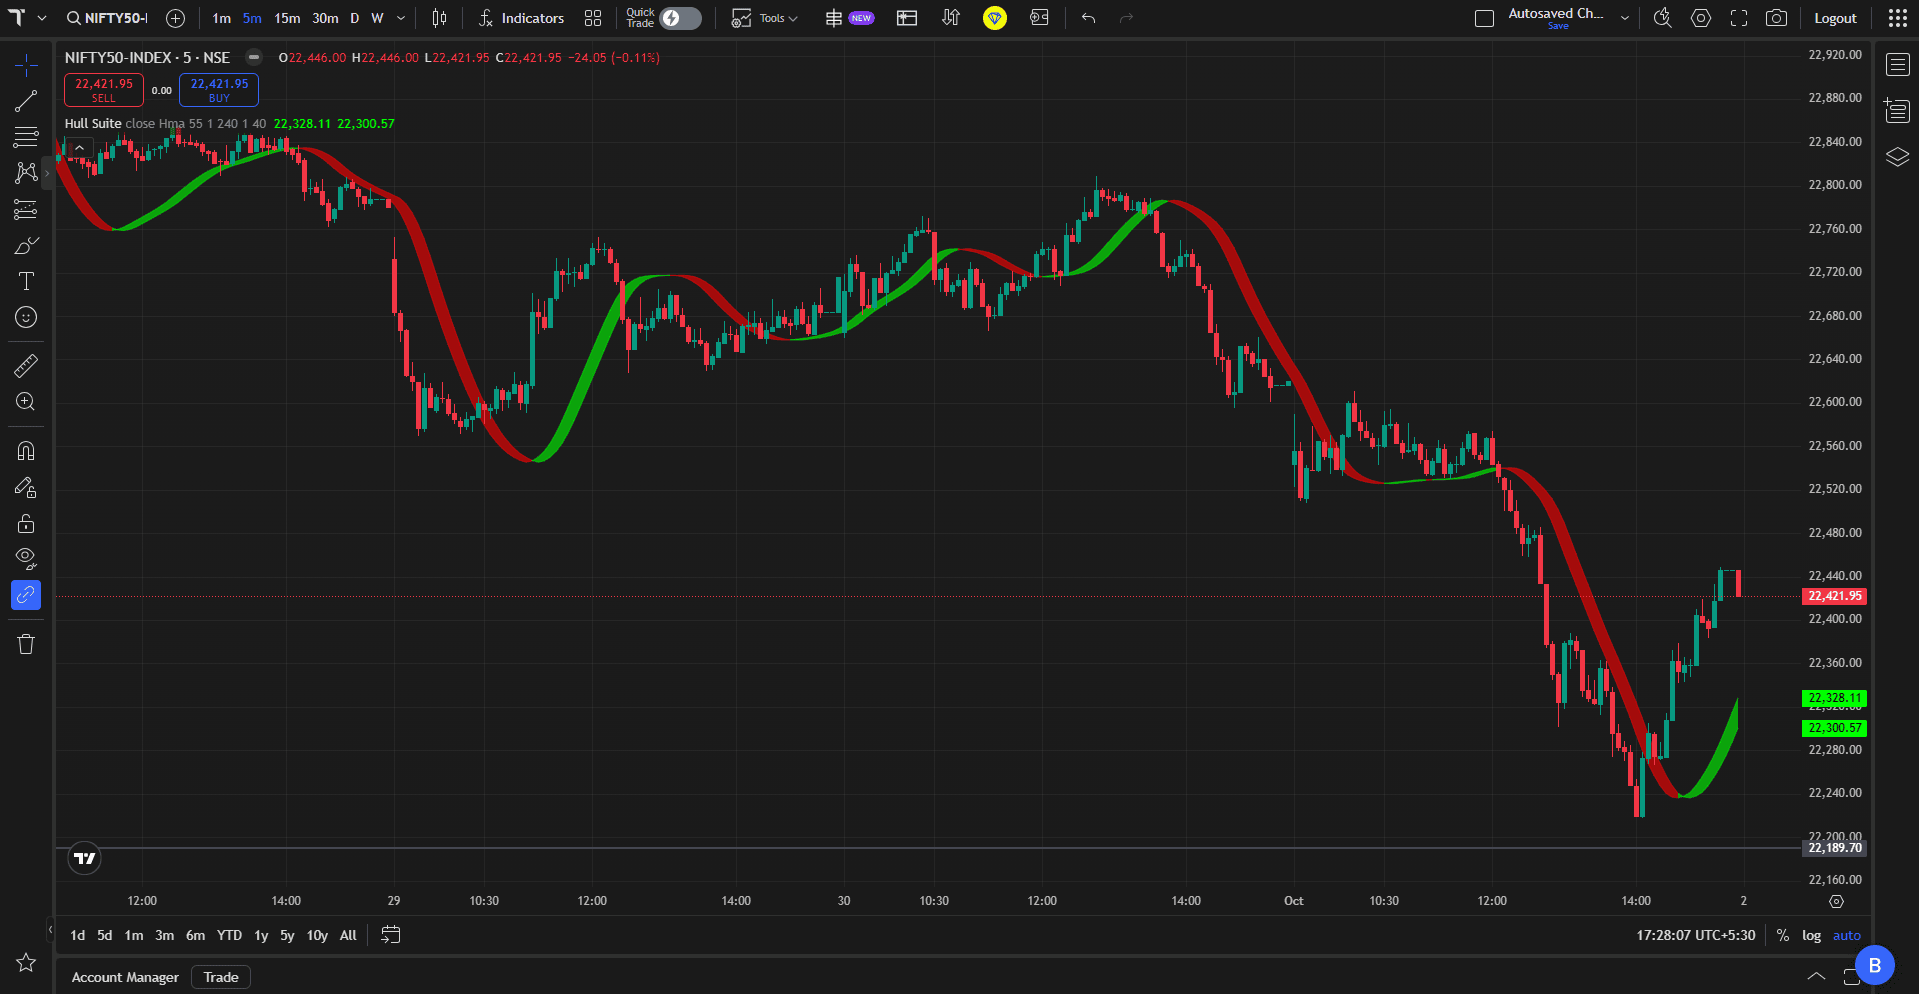
Hull Suite
Trends rarely move in a straight line.
A stock may continue moving higher overall while going through several smaller pullbacks along the way. Looking at every short-term fluctuation independently can make it harder to understand whether the broader trend is still intact.
Hull Suite, based on the Hull Moving Average, helps smooth shorter-term price movements and makes the prevailing trend direction easier to follow.
It tends to be more useful when the market is trending clearly. During sideways or choppy conditions, its direction can change more frequently.
For a deeper look at its settings and behaviour across different market conditions, refer to our Hull Suite blog.
Negative Volume Index (NVI)
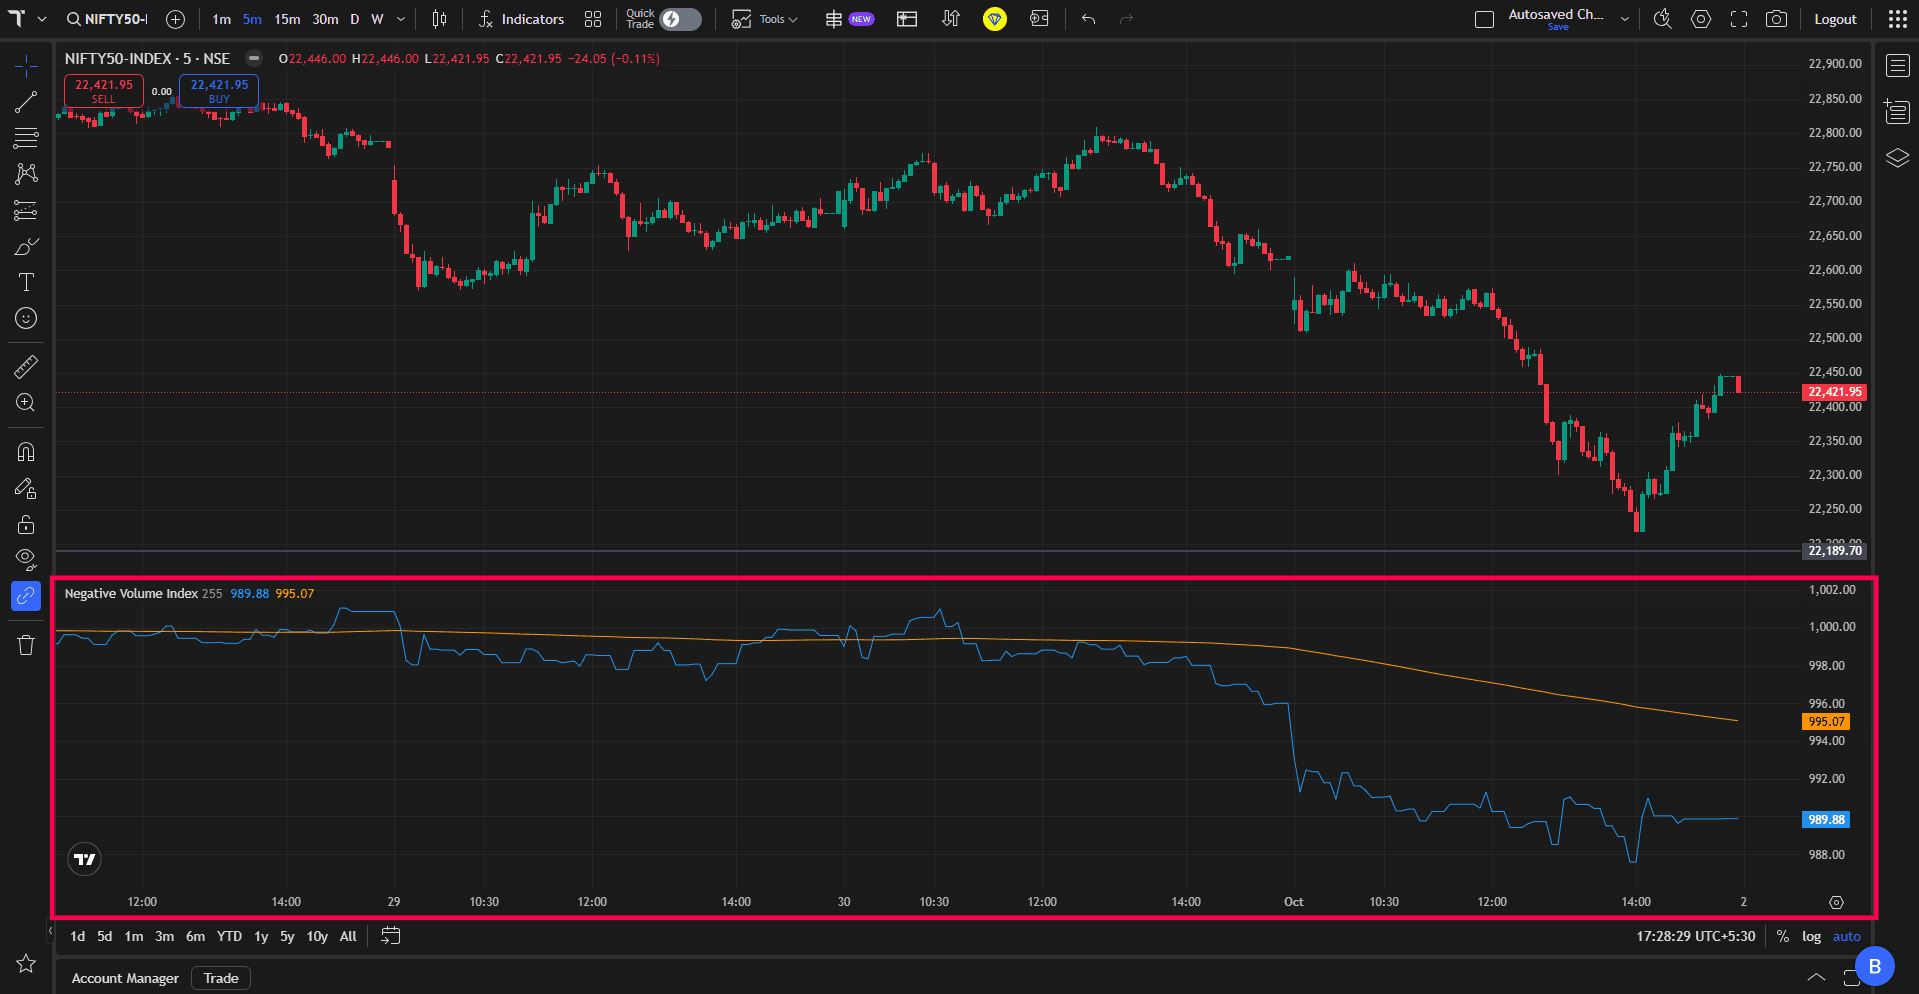
Negative Volume Index focuses on periods when volume is lower than the previous candle.
When volume declines, NVI changes based on the corresponding price movement. When volume is equal to or higher than the previous candle, the index remains unchanged.
This lets you study how price behaves during relatively lower-volume periods and observe whether those movements align with the broader market trend.
To understand the calculation and interpretation of NVI in more detail, refer to our NVI blog.
Positive Volume Index (PVI)
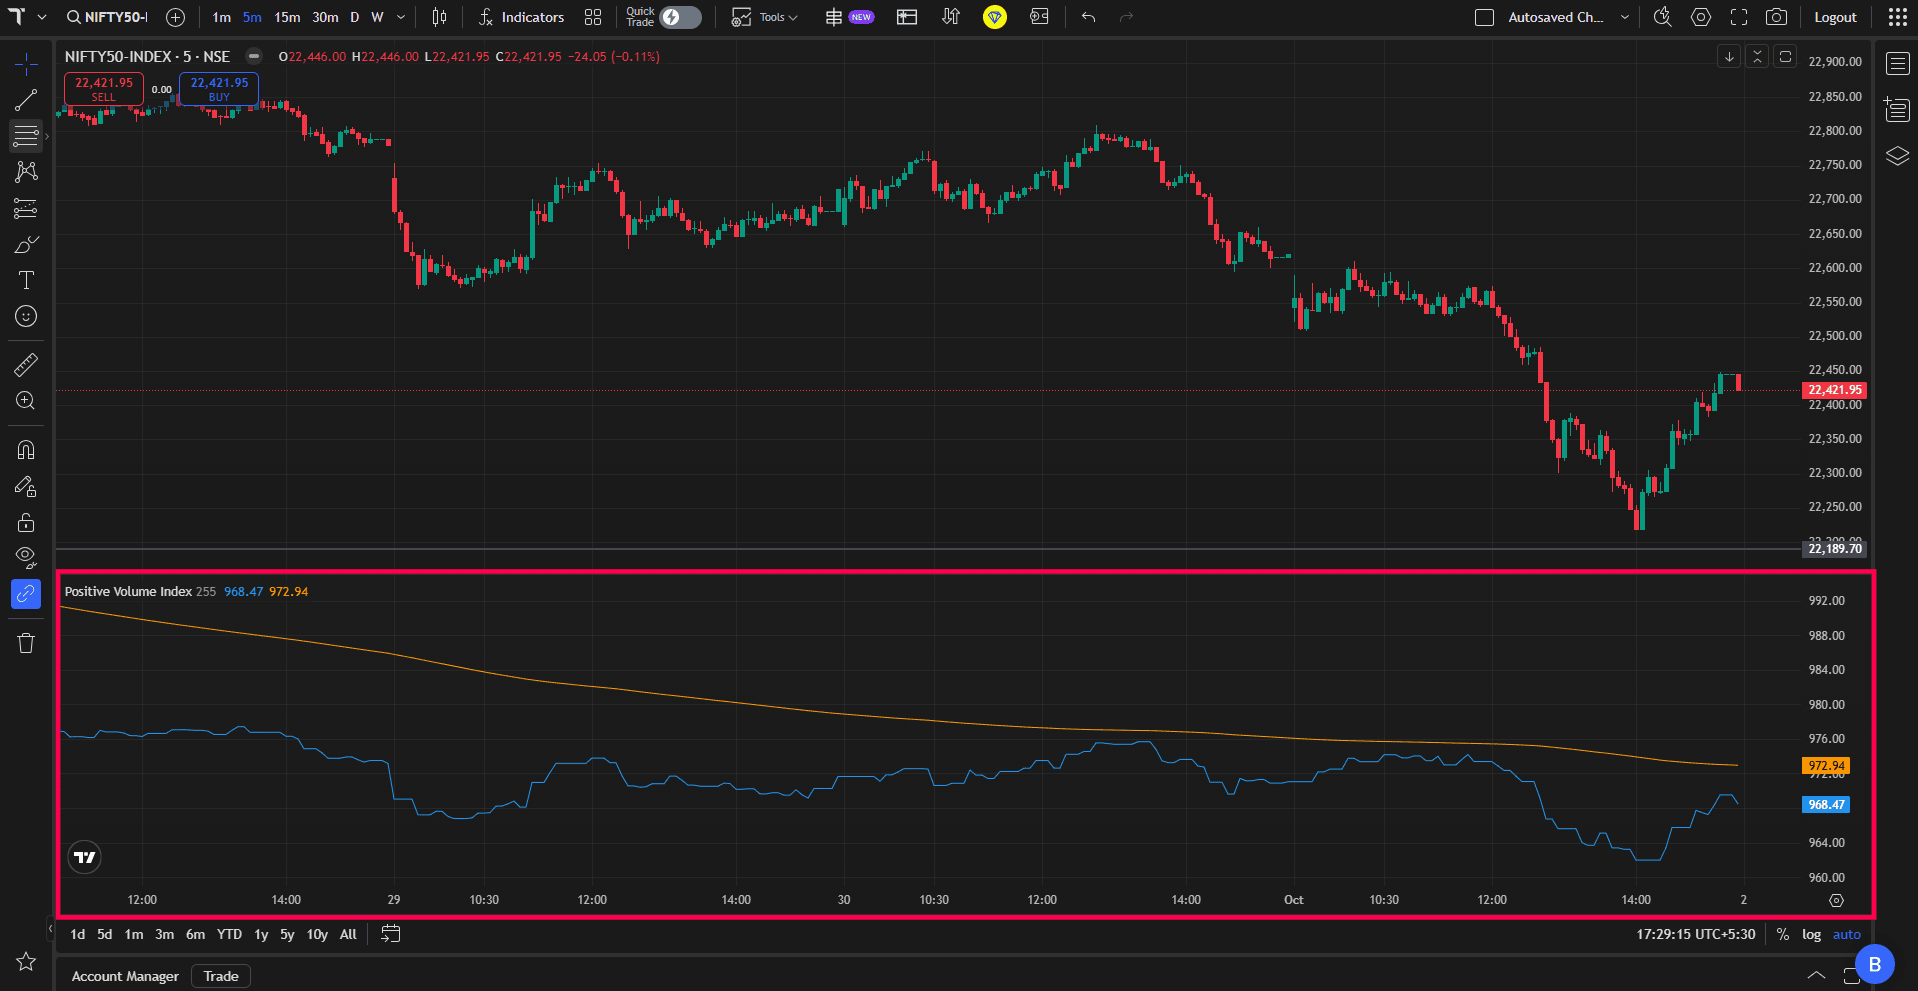
Positive Volume Index looks at the opposite condition.
PVI changes when volume is higher than the previous candle, allowing you to study how price behaves during periods of increased market participation.
For example, if price and PVI are both rising while volume expands, you can observe whether increased participation is accompanying the price move instead of analysing price in isolation.
For more details on how PVI is calculated and interpreted, refer to our PVI blog.
Available on FYERS Charts
All four indicators are now available on FYERS Charts.
Open the Indicators menu, search for the indicator you want to use and add it to your chart. You can then adjust its settings based on the instrument, timeframe and type of analysis you follow.
While we continue adding new indicators based on traders’ feedback, we are also building the capability to create and add custom indicators directly on FYERS Smart Charts, giving traders more flexibility to analyse markets their own way.
Explore the new indicators and let us know what you would like to see added next.


 Excellent, never imagined to see it anywhere other than TV, Kudos well done


