Every trader develops their own way of analysing the market. As you spend more time looking at charts, you begin to notice certain price patterns, identify relationships in market movements, and develop ideas that you want to explore.
Sometimes, it’s a calculation you want to test. Sometimes, it’s a specific set of conditions you want to track. Or you have an entirely new way of interpreting or visualising market data that isn’t covered by any existing indicator.
The challenge is that the indicators available on a chart are built around predefined calculations and logic. While they serve different purposes, they may not always match what you have in mind. You might find something close to your idea, but that doesn’t necessarily mean it works the way you want it to.
But why should your analysis be limited to indicators that already exist? What if you could turn any trading idea into an indicator and plot it directly on the chart?
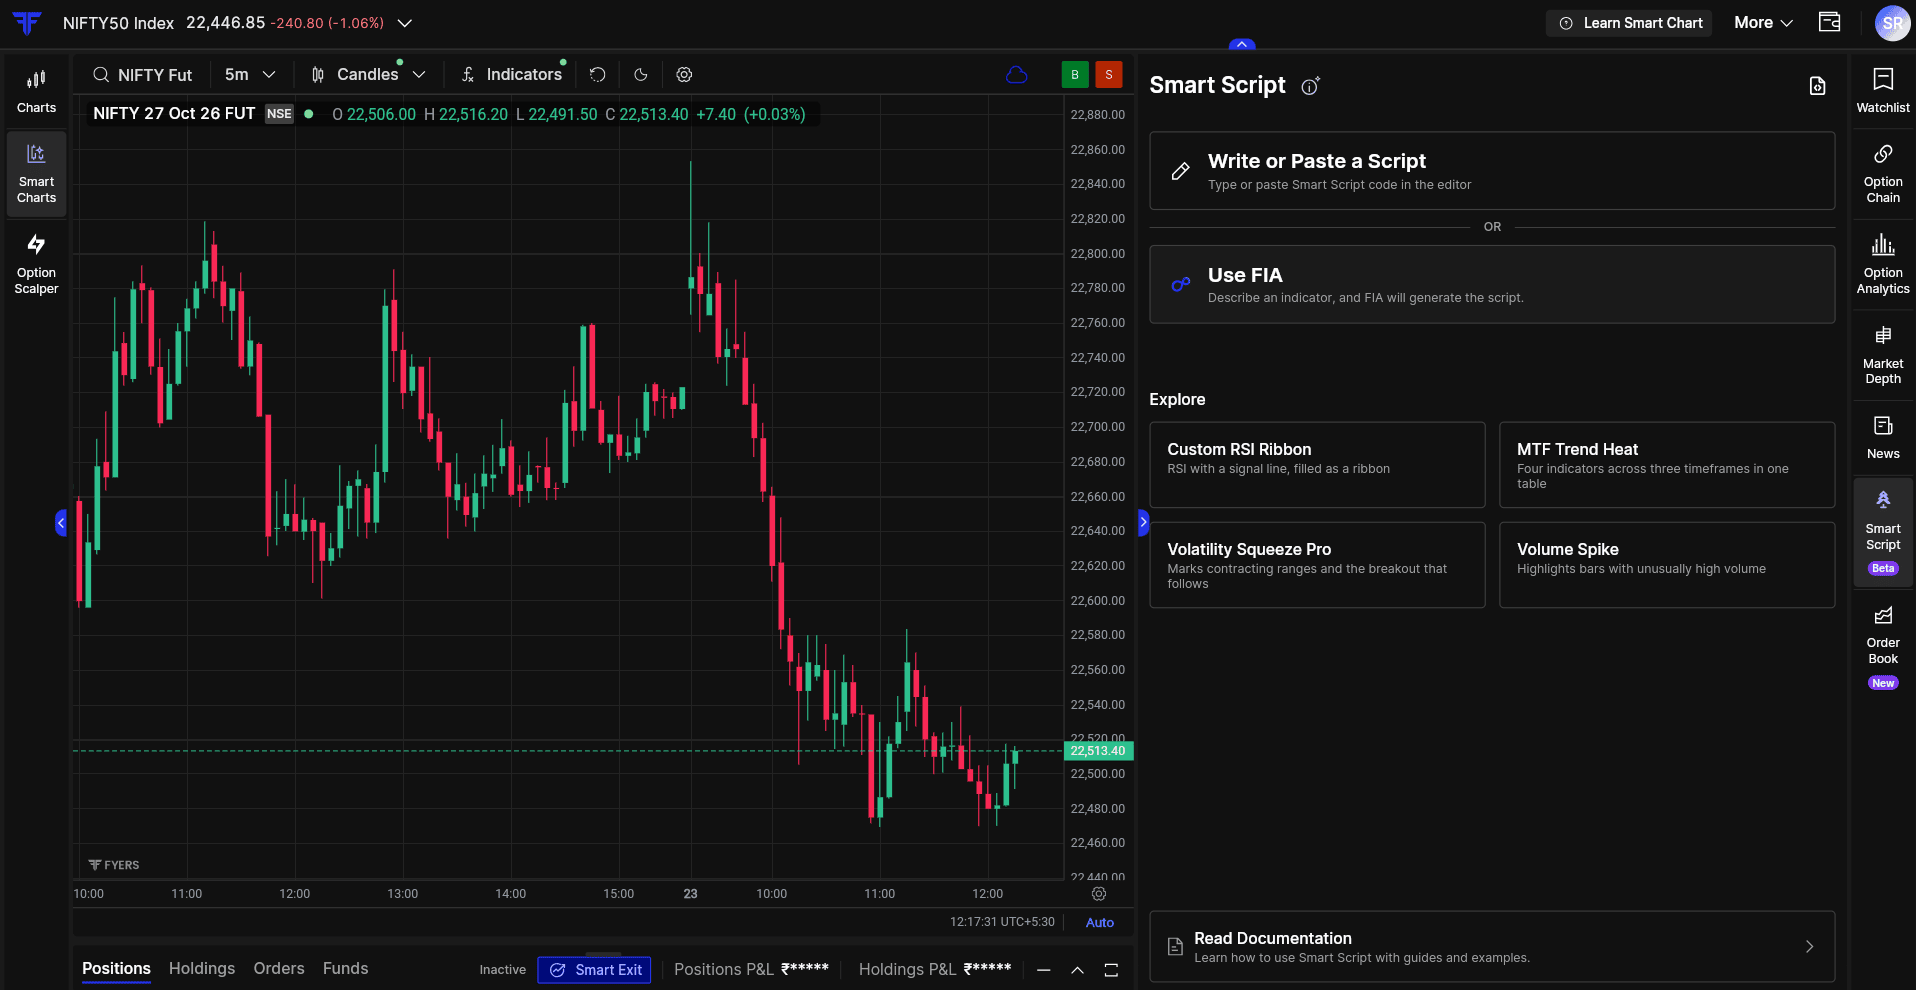
That’s why we’re introducing Smart Script on FYERS Smart Charts, which lets you create custom indicators using your own calculations, conditions, and logic, and visualise market information the way you want.
We’ve made it possible to build these indicators in two ways. If you’re comfortable with coding, you can use the Script Editor to develop your own indicators. If you have an idea but don’t know how to code it, FIA can help you turn that idea into an indicator.
Build Your Own Indicators With the Script Editor
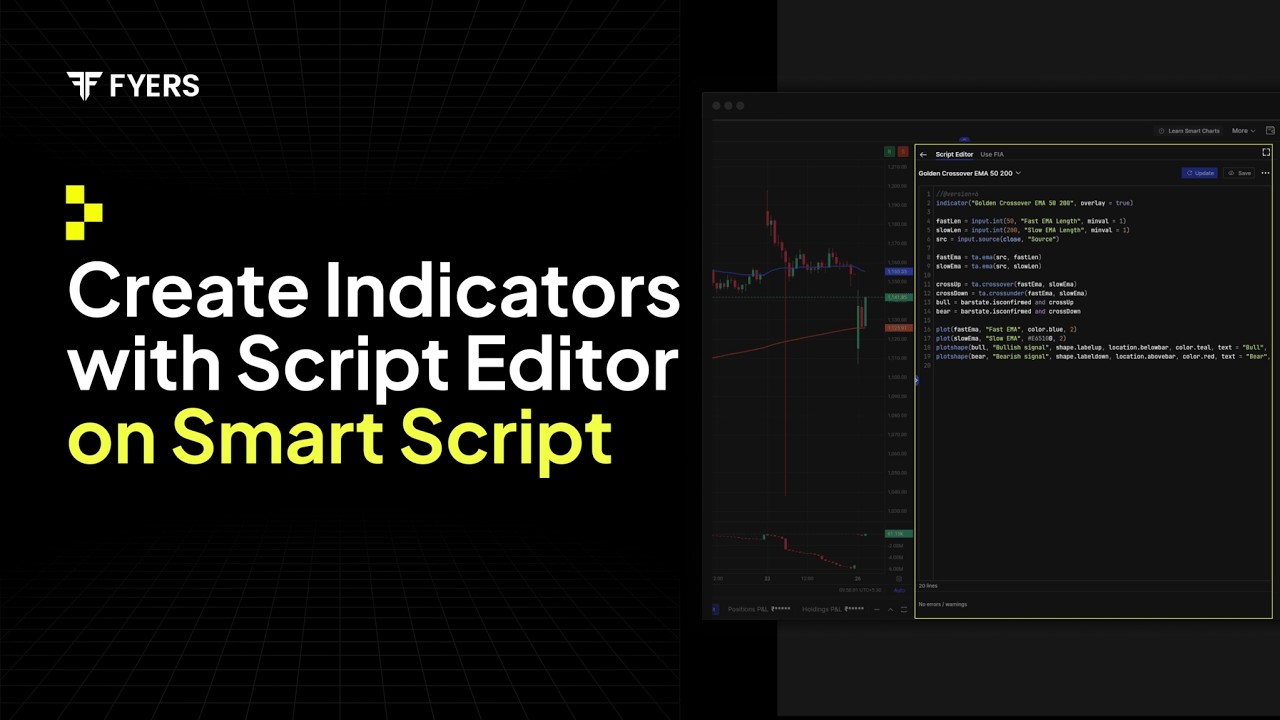
The Script Editor gives you control over how your indicator works. You can write code from scratch or paste an existing script, define the calculations and rules you want to follow, and specify how the results should appear on the chart.
Once your script is ready, you can apply it to the chart and observe how it behaves. If something needs to change, you can return to the editor, modify the code, and check the results again. This gives you the flexibility to develop and improve your indicator as your understanding of the market evolves.
We’ve also integrated FIA into the Script Editor to assist with coding errors. If your script isn’t working as expected, FIA can help identify the issue and suggest corrections. Scripting documentation and support are also available within the editor whenever you need guidance.
But we also recognise that having a trading idea and knowing how to code it are two different things. That’s where FIA comes in.
Turn Your Trading Ideas Into Indicators With FIA
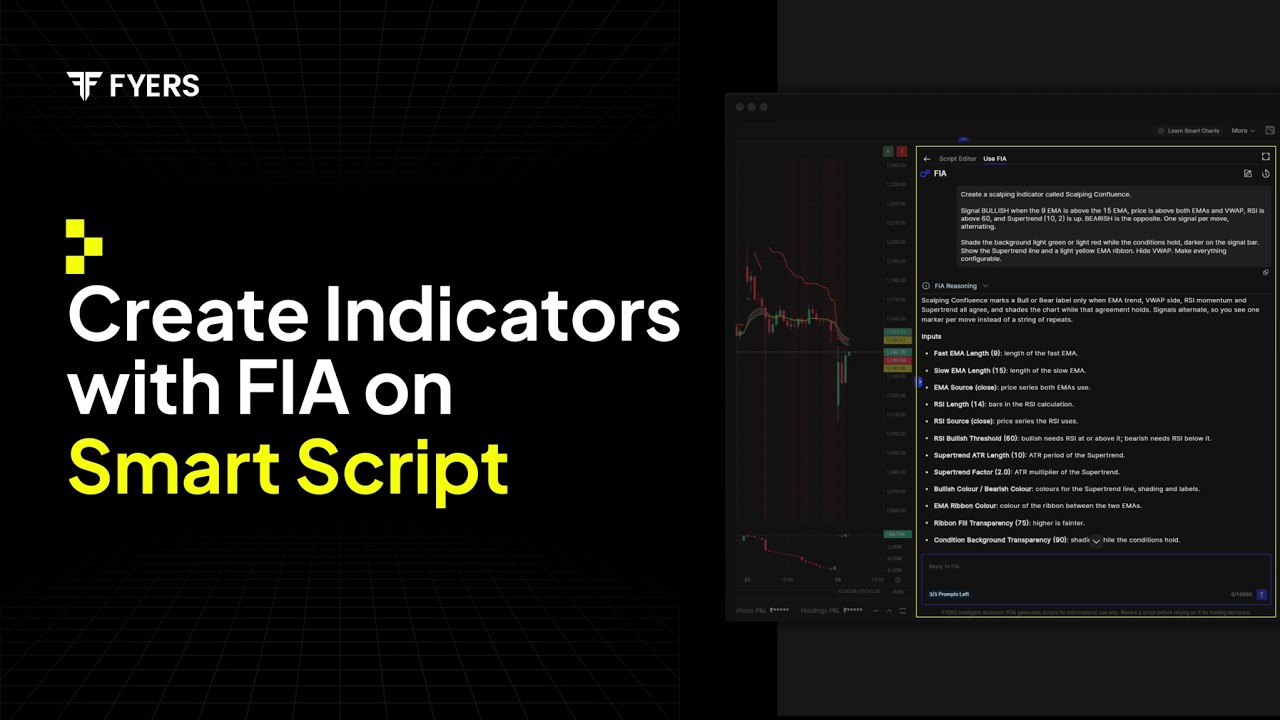
You might know exactly what you want to measure or display on a chart without knowing how to write the code for it. With FIA, you can describe what you have in mind in plain language, and it helps generate a script based on your instructions.
You could develop a new way of measuring price momentum, identify a particular candlestick behaviour, create signals based on conditions you’ve defined, or design a different way of displaying market information. You’re not restricted to recreating existing indicators. You can start with a completely new concept and explain how you want it to work.
FIA helps translate those instructions into indicator you can review and apply to your chart. If the output isn’t quite what you expected, you can ask FIA to change the calculation, add or remove conditions, or modify the visualisation until it better reflects what you had in mind.
This means you can focus on the trading concept you want to explore while FIA helps with the coding.
Example: Create a scalping indicator called Scalping Confluence.
Signal BULLISH when the 9 EMA is above the 15 EMA, price is above both EMAs and VWAP, RSI is above 60, and Supertrend (10, 2) is up. BEARISH is the opposite. One signal per move, alternating.
Shade the background light green or light red while the conditions hold, darker on the signal bar. Show the Supertrend line and a light yellow EMA ribbon. Hide VWAP. Make everything configurable.
Save and Refine Your Indicators
As you develop different indicators, you’ll want to keep the ones you find useful and revisit them whenever needed.
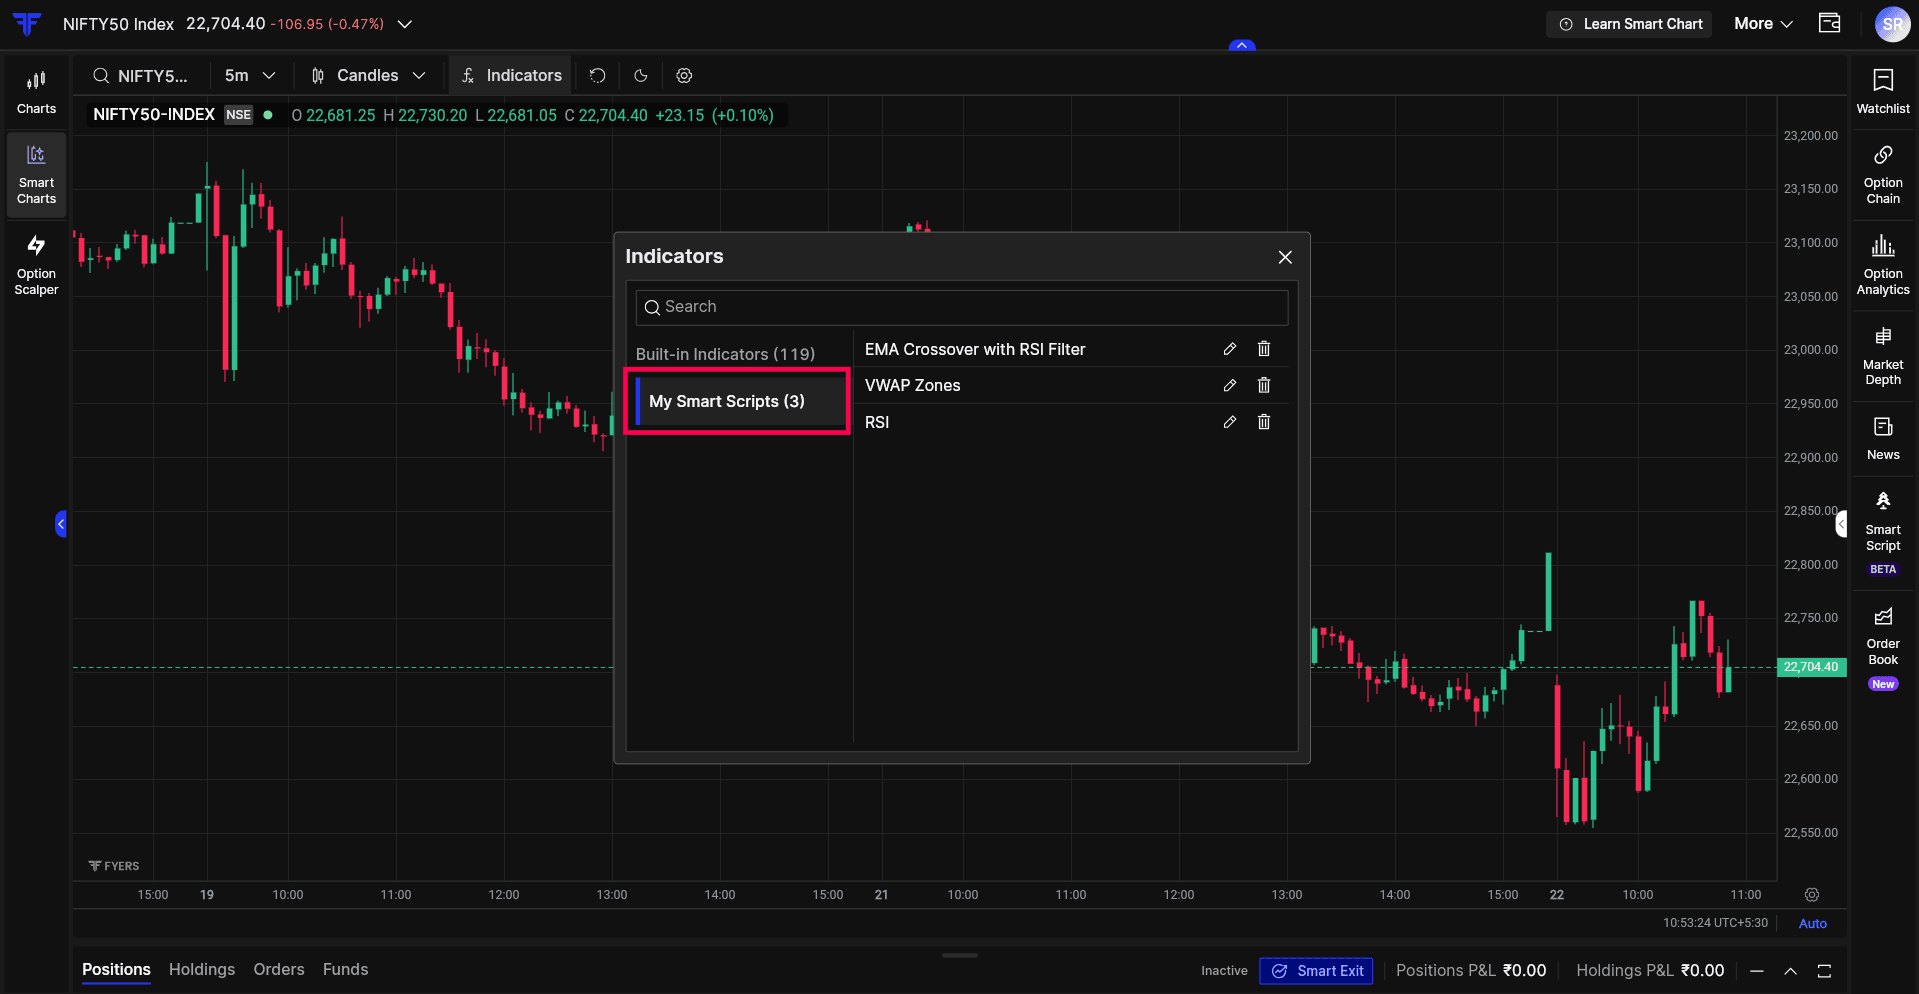
All your saved scripts are available under My Smart Scripts in the Indicators section of FYERS Smart Charts. You can access them anytime, edit existing scripts, or remove those you no longer use.
This also makes it easier to revisit earlier work and build on it as your trading approach changes.
Build around the way you trade
We know that every trader approaches the market differently, and some of the most interesting ideas come from observing patterns, questioning existing methods, and trying something new.
With Smart Script, we want to make it easier for you to take those ideas beyond observation and see how they work on a chart. Whether you write the code yourself or use FIA to help build it, you have the flexibility to develop indicators that reflect how you analyse the market.
Explore Smart Script on FYERS Smart Charts and start turning your trading ideas into custom indicators.