When you look at a regular chart, you can see how price has moved and how much volume has been traded. But there’s another side of market activity that candles don’t show. Throughout the trading day, buy and sell orders are waiting at different price levels.
At FYERS, we introduced Order Flow on Smart Charts, our in-house charting platform, to help traders understand the buying and selling activity behind executed trades. But we wanted to go a step further and give traders visibility into the liquidity available in the market, beyond the trades that have already taken place.
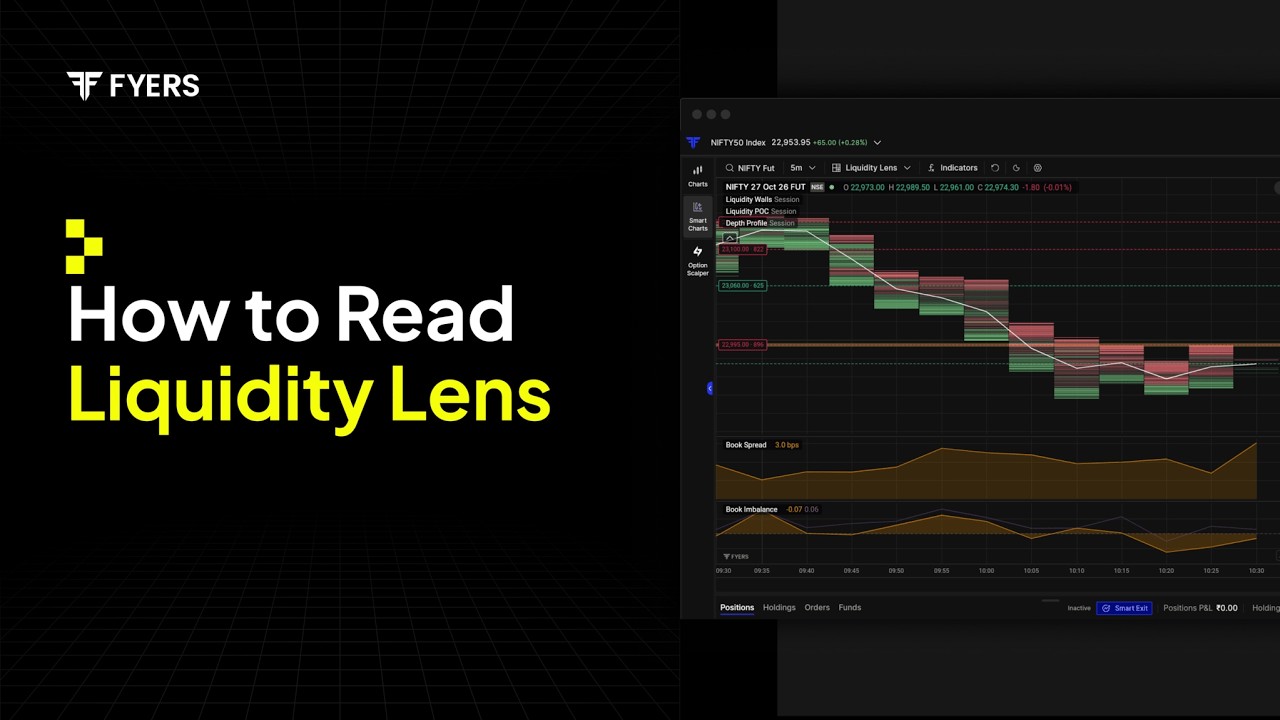
That’s why we’re introducing Liquidity Lens on Smart Charts. It brings resting buy and sell orders directly onto the chart, allowing traders to see where liquidity is concentrated and how it changes alongside price movement.
For more details refer to this article.
Size and Pressure: Two Ways to Read Liquidity
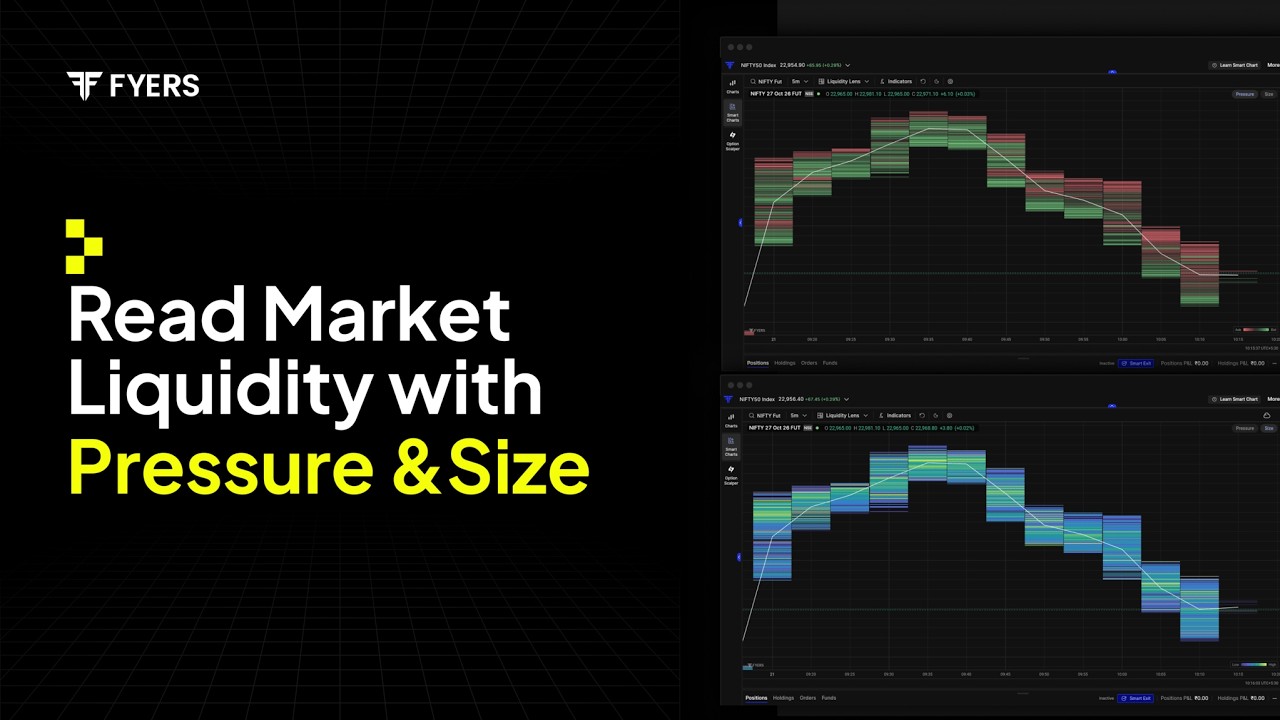
Size: See Where Liquidity Is Concentrated
When you’re watching a stock, you may want to know which price levels have the largest quantities of resting orders. Market depth shows you these numbers, but following how they change across multiple levels isn’t always practical, especially when the market is moving quickly.
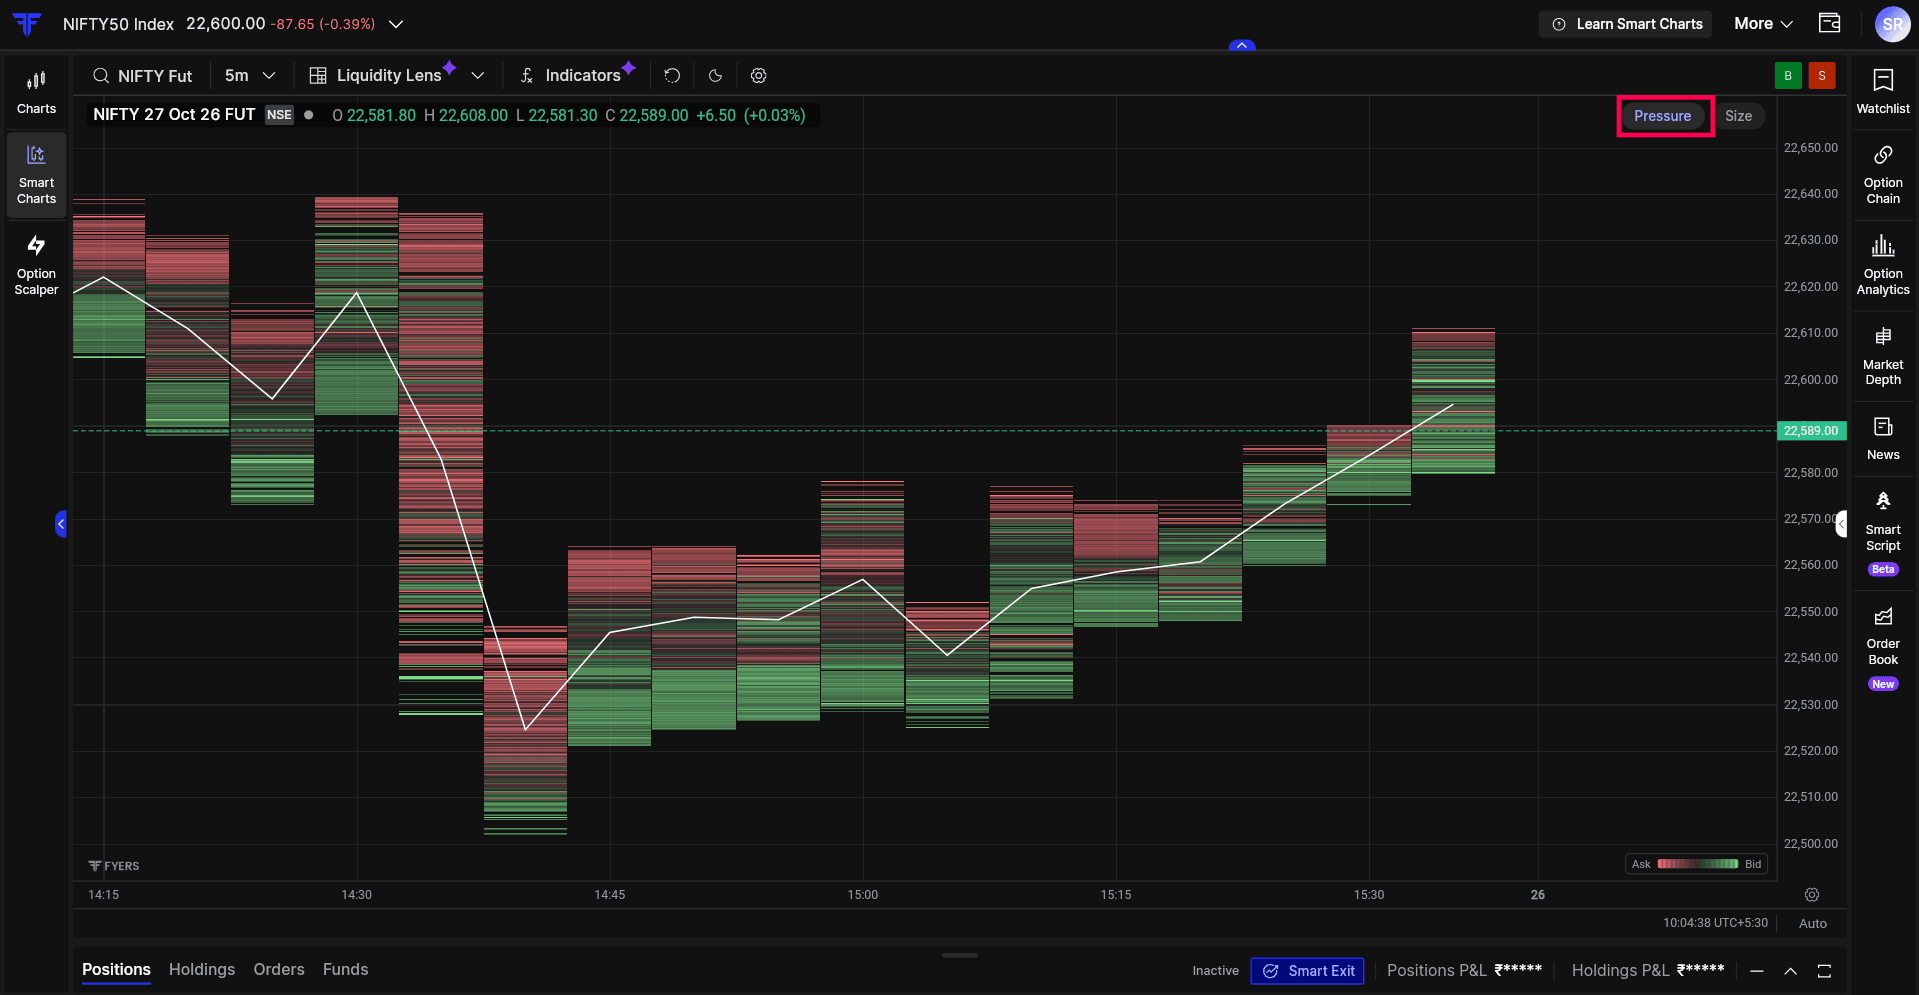
Size gives you a visual view of the total resting buy and sell quantities at different price levels, without separating them by side. Areas with larger quantities stand out more prominently, making it easier to identify where liquidity is concentrated and whether those concentrations are increasing or decreasing.
Size shows you where the larger quantities are positioned, but it doesn’t tell you how much of that liquidity is coming from buyers or sellers. That’s where Pressure becomes useful.
Pressure: Understand Which Side Has More Liquidity
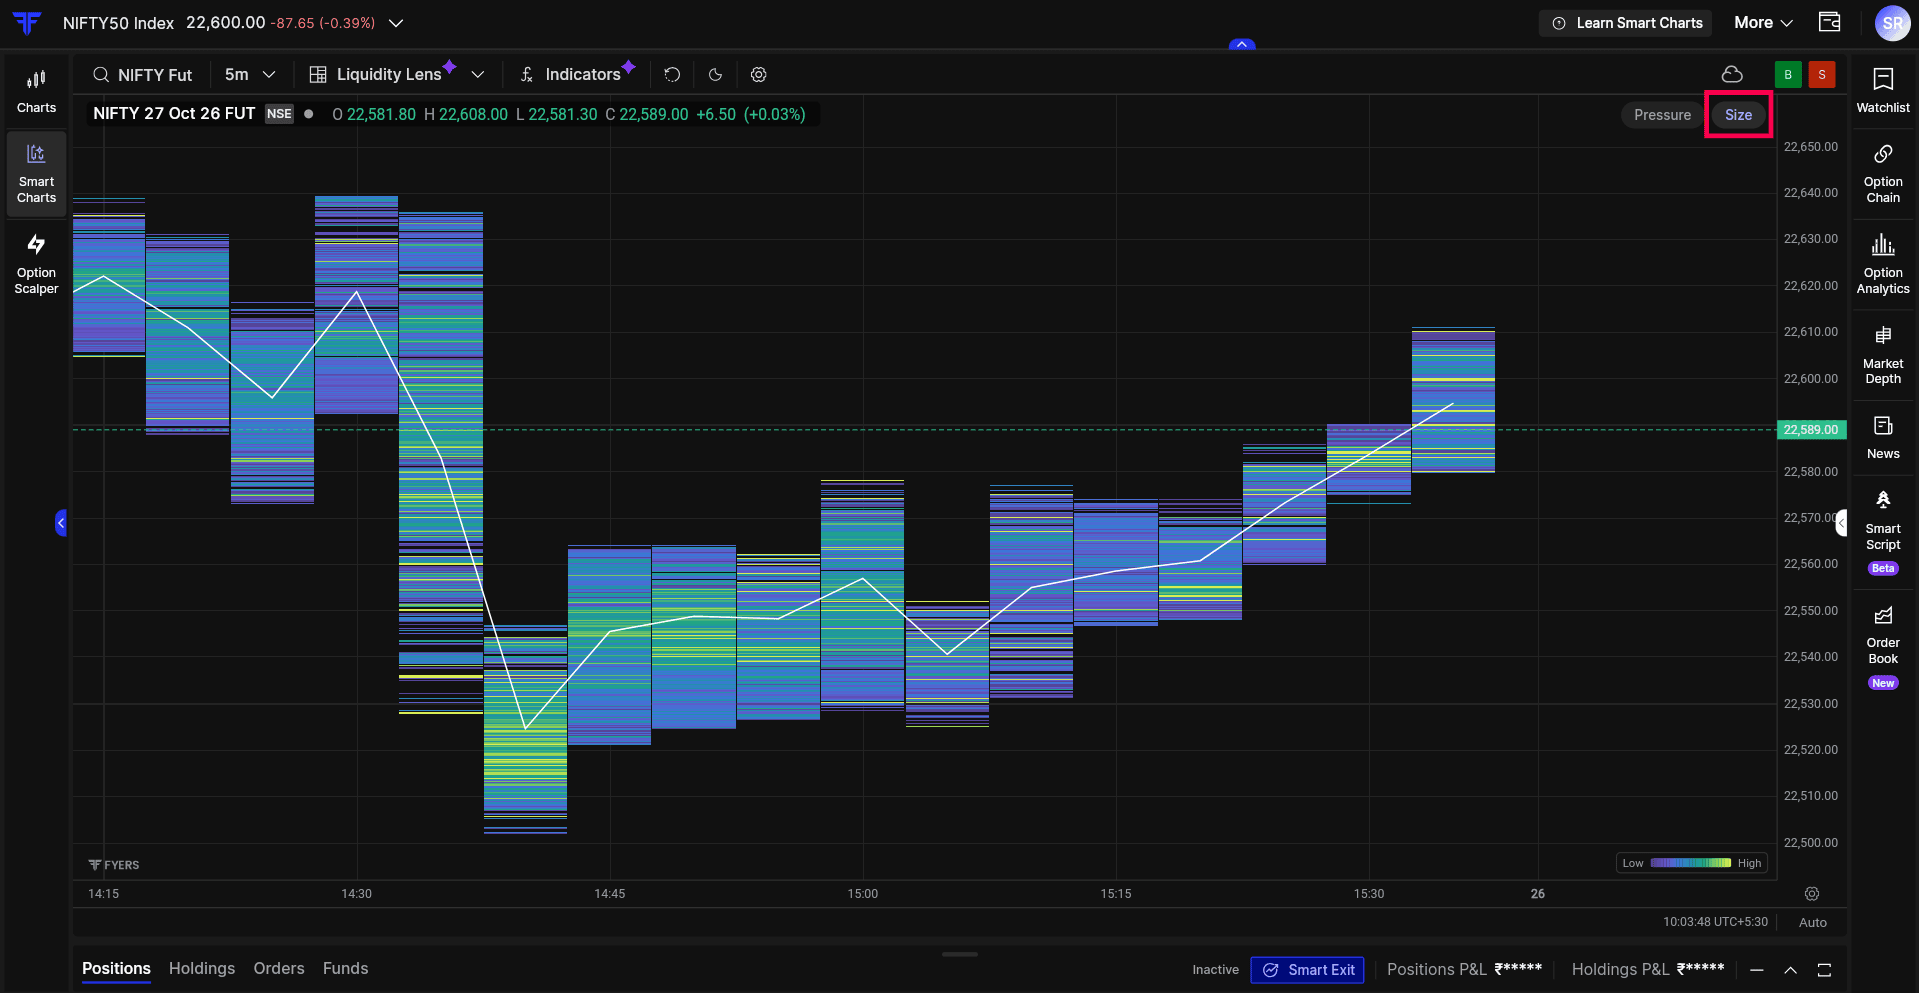
Pressure shows resting liquidity of Bid and Ask quantities, green areas indicate Bid quantities, while red areas indicate Ask quantities, allowing you to compare how orders are distributed between the two sides at different price levels.
The white line represents the midpoint between the price levels where buying and selling liquidity dominate, while the coloured areas show resting liquidity at different price levels.
As resting quantities change, you can observe whether the balance continues to favour one side or begins to shift. This is useful because areas with similar total liquidity can have very different distributions between bids and asks.
Looking at Size and Pressure together gives you both perspectives. Size shows where liquidity is concentrated, while Pressure helps you understand which side contributes more to those quantities.
You can also hover over any coloured area on the chart to view the resting Bid and Ask quantities at that price level, helping you compare the liquidity on both sides.
For more details refer to this article.
Order Book and Book Pressure: View Current Market Depth
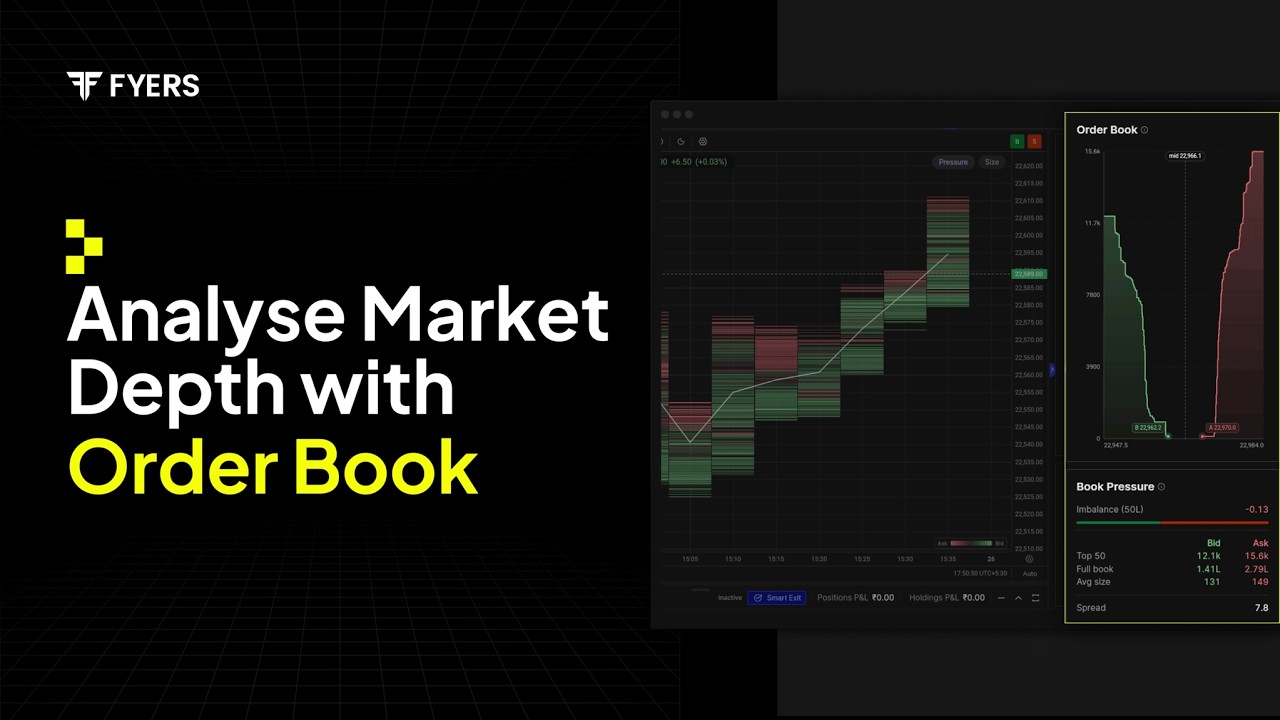
The Liquidity Lens chart shows how liquidity has changed over time, while the Order Book provides a view of the resting orders currently available in the market.
Order Book: See the Current Buy and Sell Quantities
The Order Book displays cumulative buy and sell quantities across different price levels. The bid-side and ask-side curves show how resting quantities build up as you move away from the current market price, helping you understand where liquidity is positioned.
The chart also displays three important reference points: B (Best Bid) represents the highest buying price, A (Best Ask) represents the lowest selling price, and Mid shows the midpoint between them.
By observing the curves, you can understand whether resting liquidity is concentrated close to the current price or spread across a wider range of levels.
Book Pressure: Understand the Balance Between Buyers and Sellers
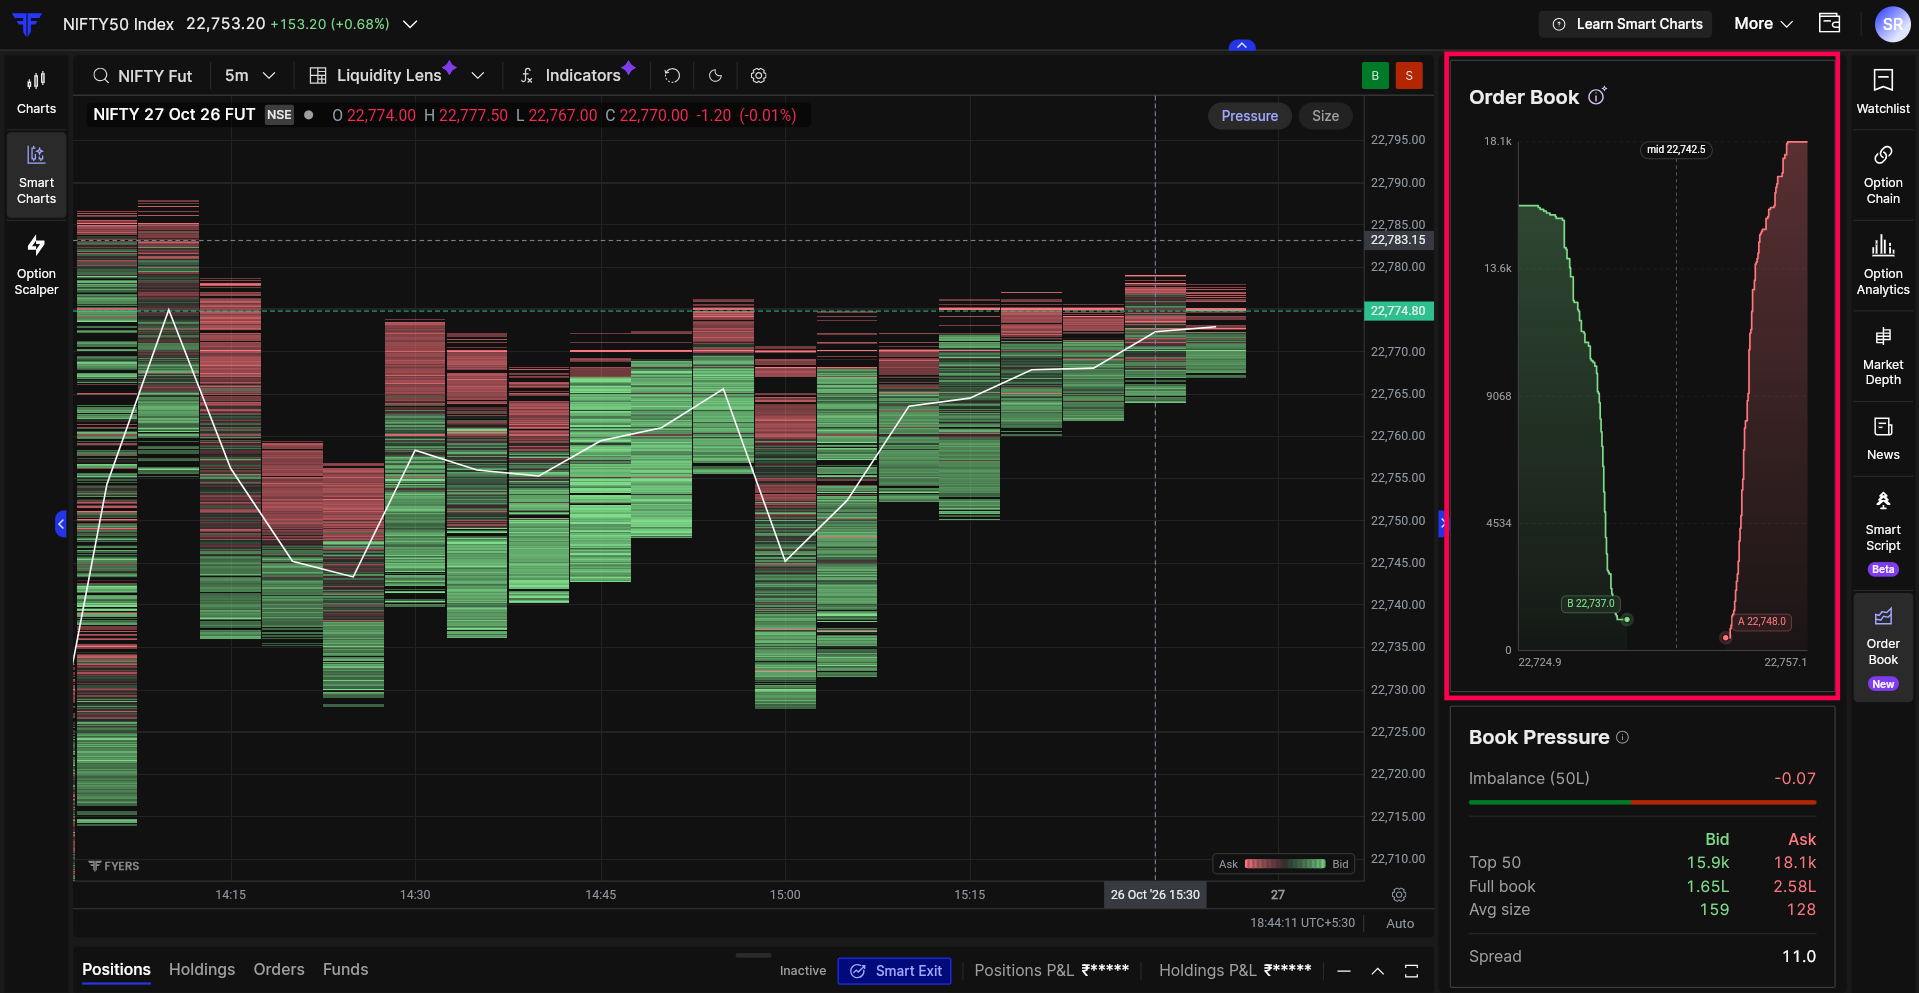
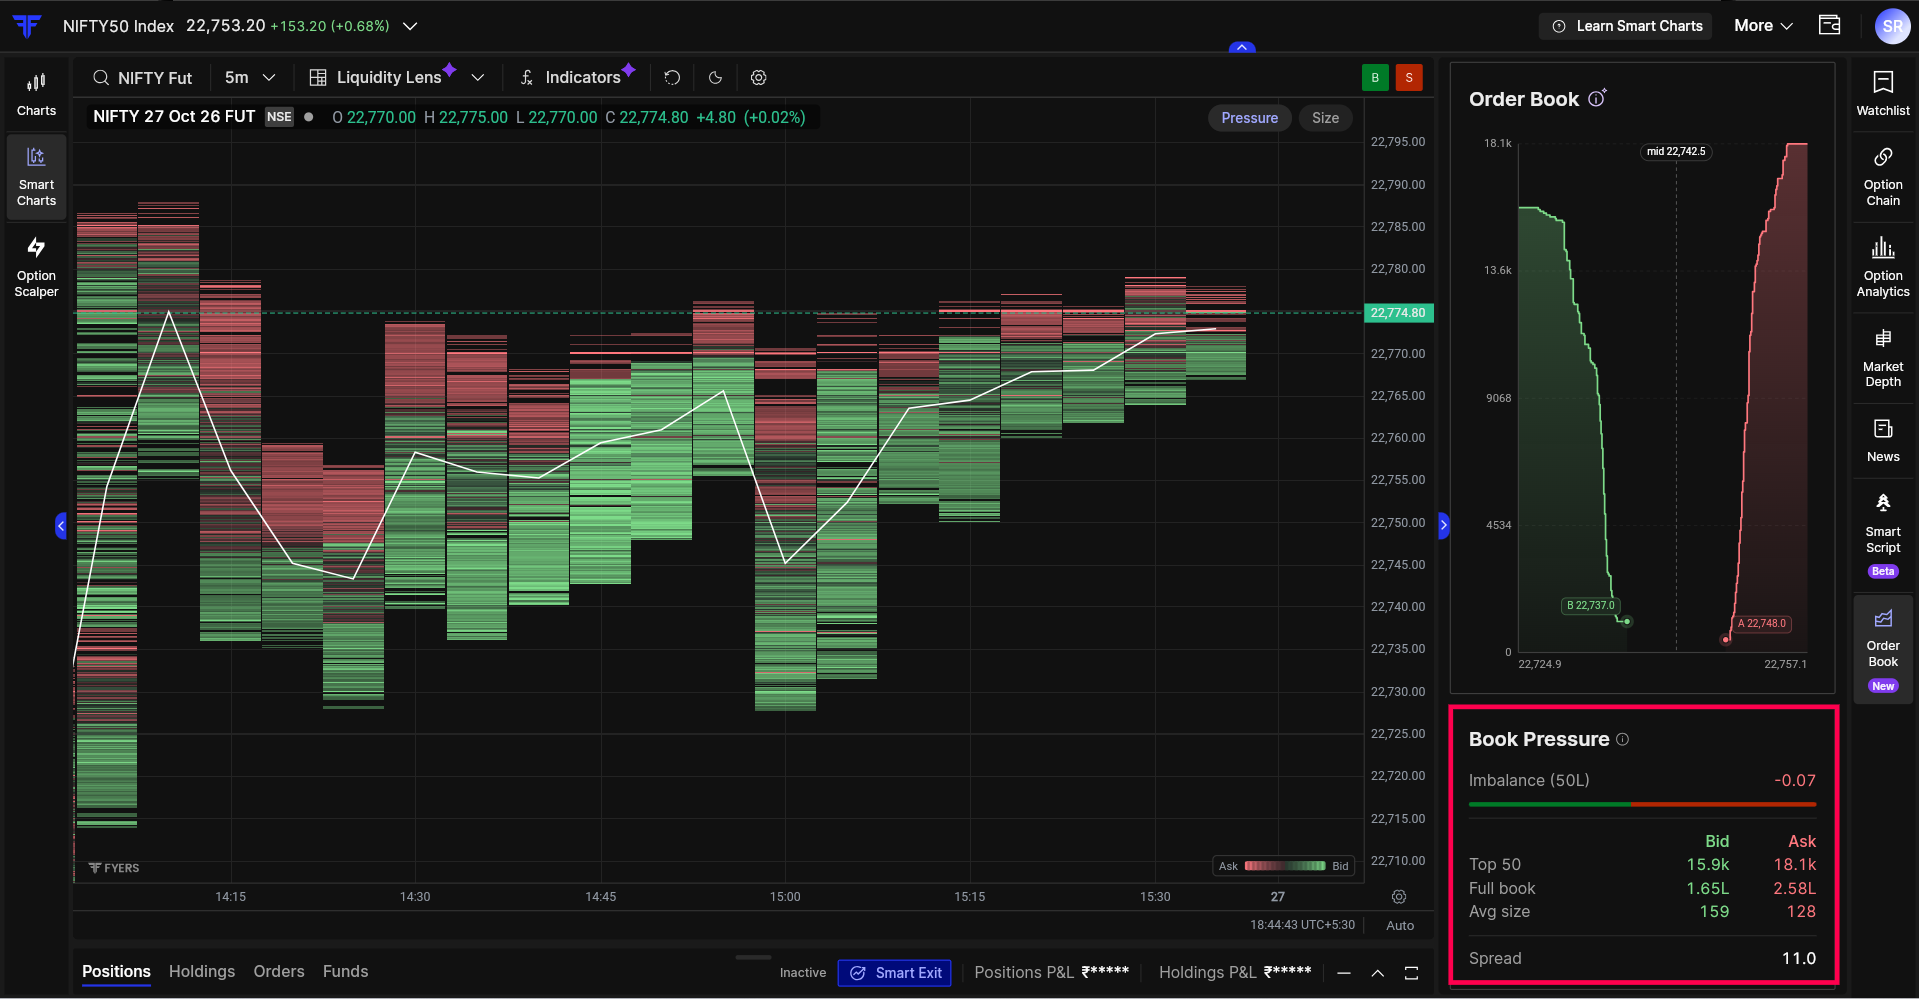
Book Pressure brings together important order-book information, including resting buy and sell quantities, imbalance, average order size and spread.
The Imbalance bar shows which side has more resting liquidity across the top 50 price levels, while Top 50 and Full Book help you compare quantities near the current market price with those across the entire available order book.
You can also see the average order size on each side and the spread, which is the difference between the best bid and ask prices. Since the balance between buyers and sellers can vary across different price levels, these readings help you understand how liquidity is distributed in the order book.
For more details refer to this article.
Depth Profile, Liquidity POC and Liquidity Walls: Identify Key Liquidity Levels
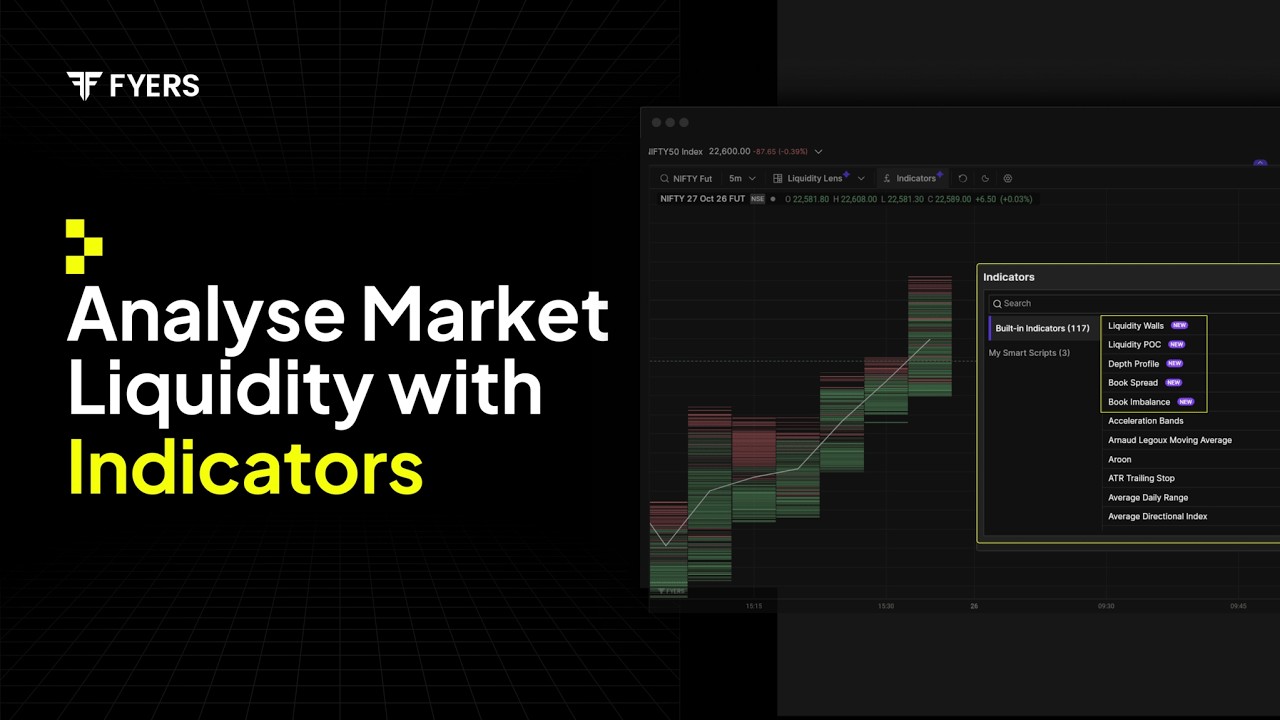
Depth Profile: Understand How Liquidity Is Distributed
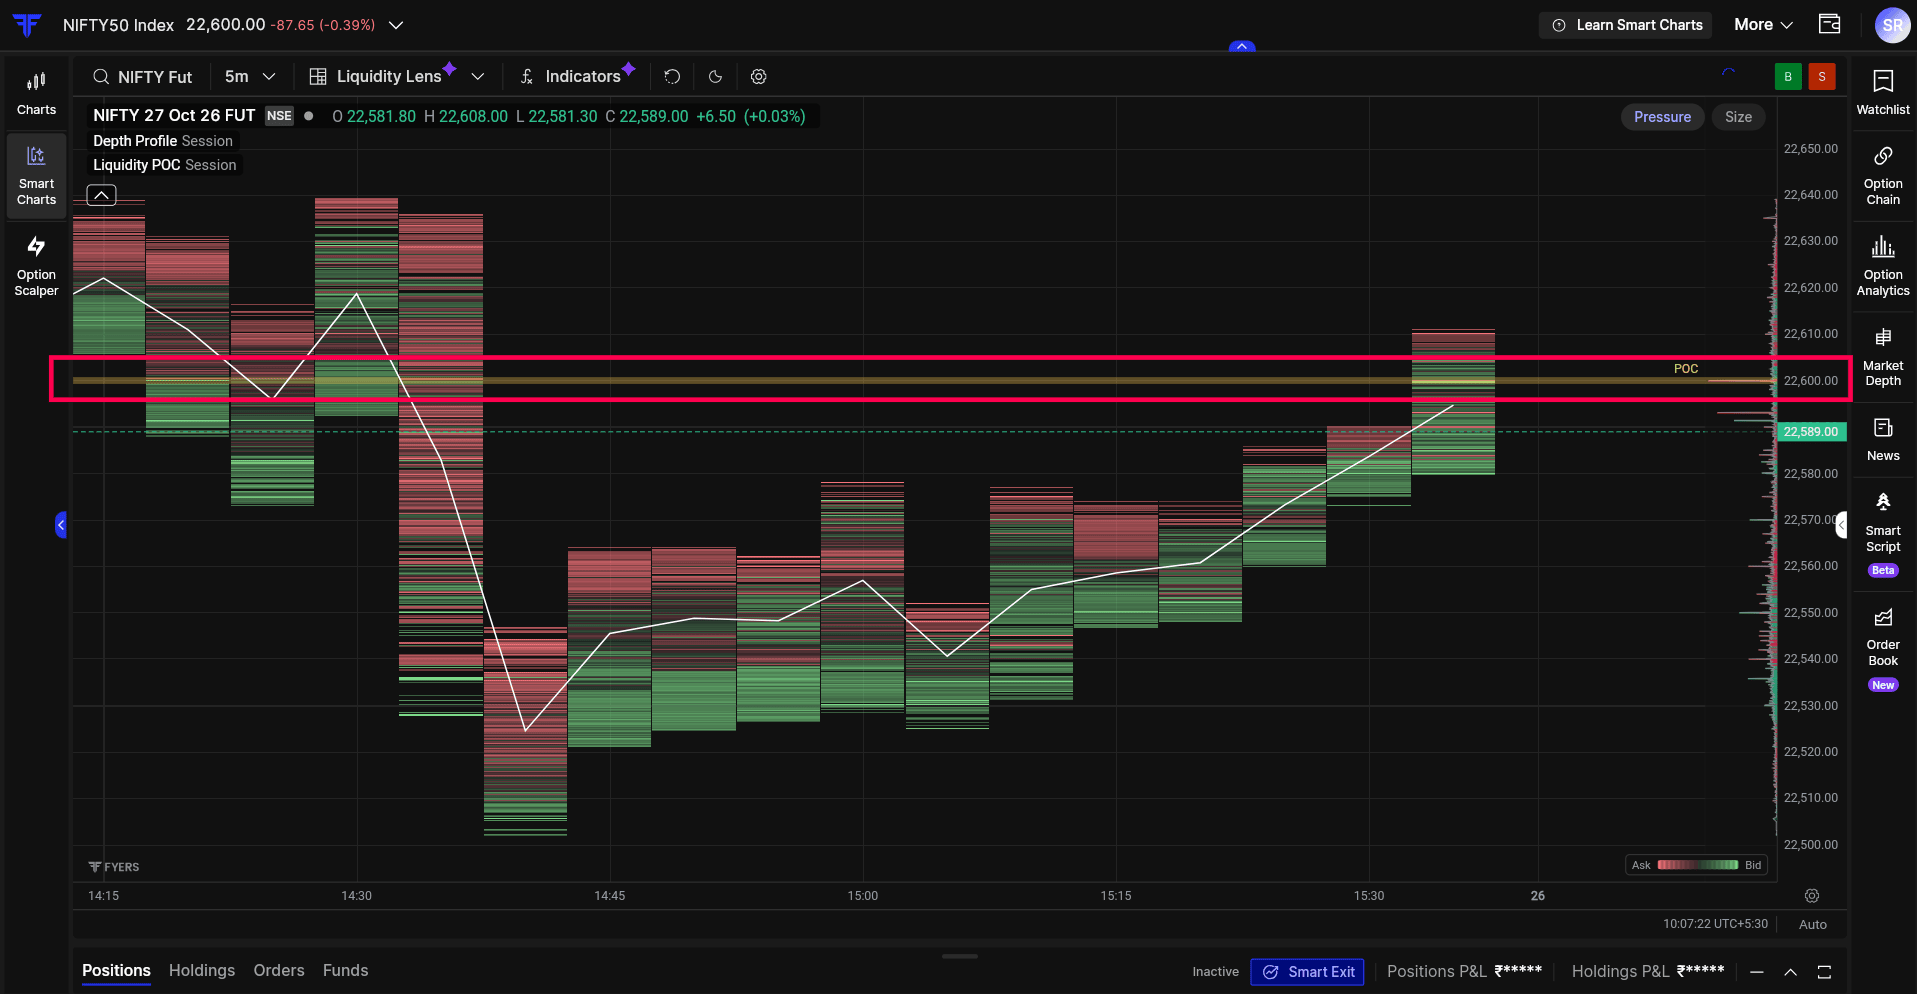
Depth Profile shows how average resting liquidity is distributed across different price levels.
It helps you to understand whether larger quantities are positioned close to the current market price or spread across levels further away. You can also compare the relative concentrations across the visible range without having to inspect each price level individually.
While Depth Profile gives you an overall view of liquidity distribution, Liquidity POC helps you identify the price level with the highest average concentration.

Liquidity POC: Identify the Highest Concentration
Liquidity Point of Control (POC), identifies the price level with the highest average resting liquidity within the visible chart range.
If you’ve used Volume Profile, you’ll be familiar with the idea of a Point of Control. The difference is that Volume Profile POC is based on completed trades, while Liquidity POC looks at resting orders.
This distinction matters because the price level where the most trading has taken place may not be the same level where the largest quantity of resting orders is positioned. Liquidity POC helps you identify that concentration directly on the chart, giving you a reference for where the most prominent resting liquidity is located within the range you’re studying.
Liquidity Walls: Track Changes in Resting Orders
If you’ve spent time watching market depth, you’ve probably noticed large quantities of buy or sell orders appearing at certain price levels. Some remain visible as price moves closer, while others reduce or disappear before price reaches them.
With the order book updating continuously, these changes can be easy to miss.
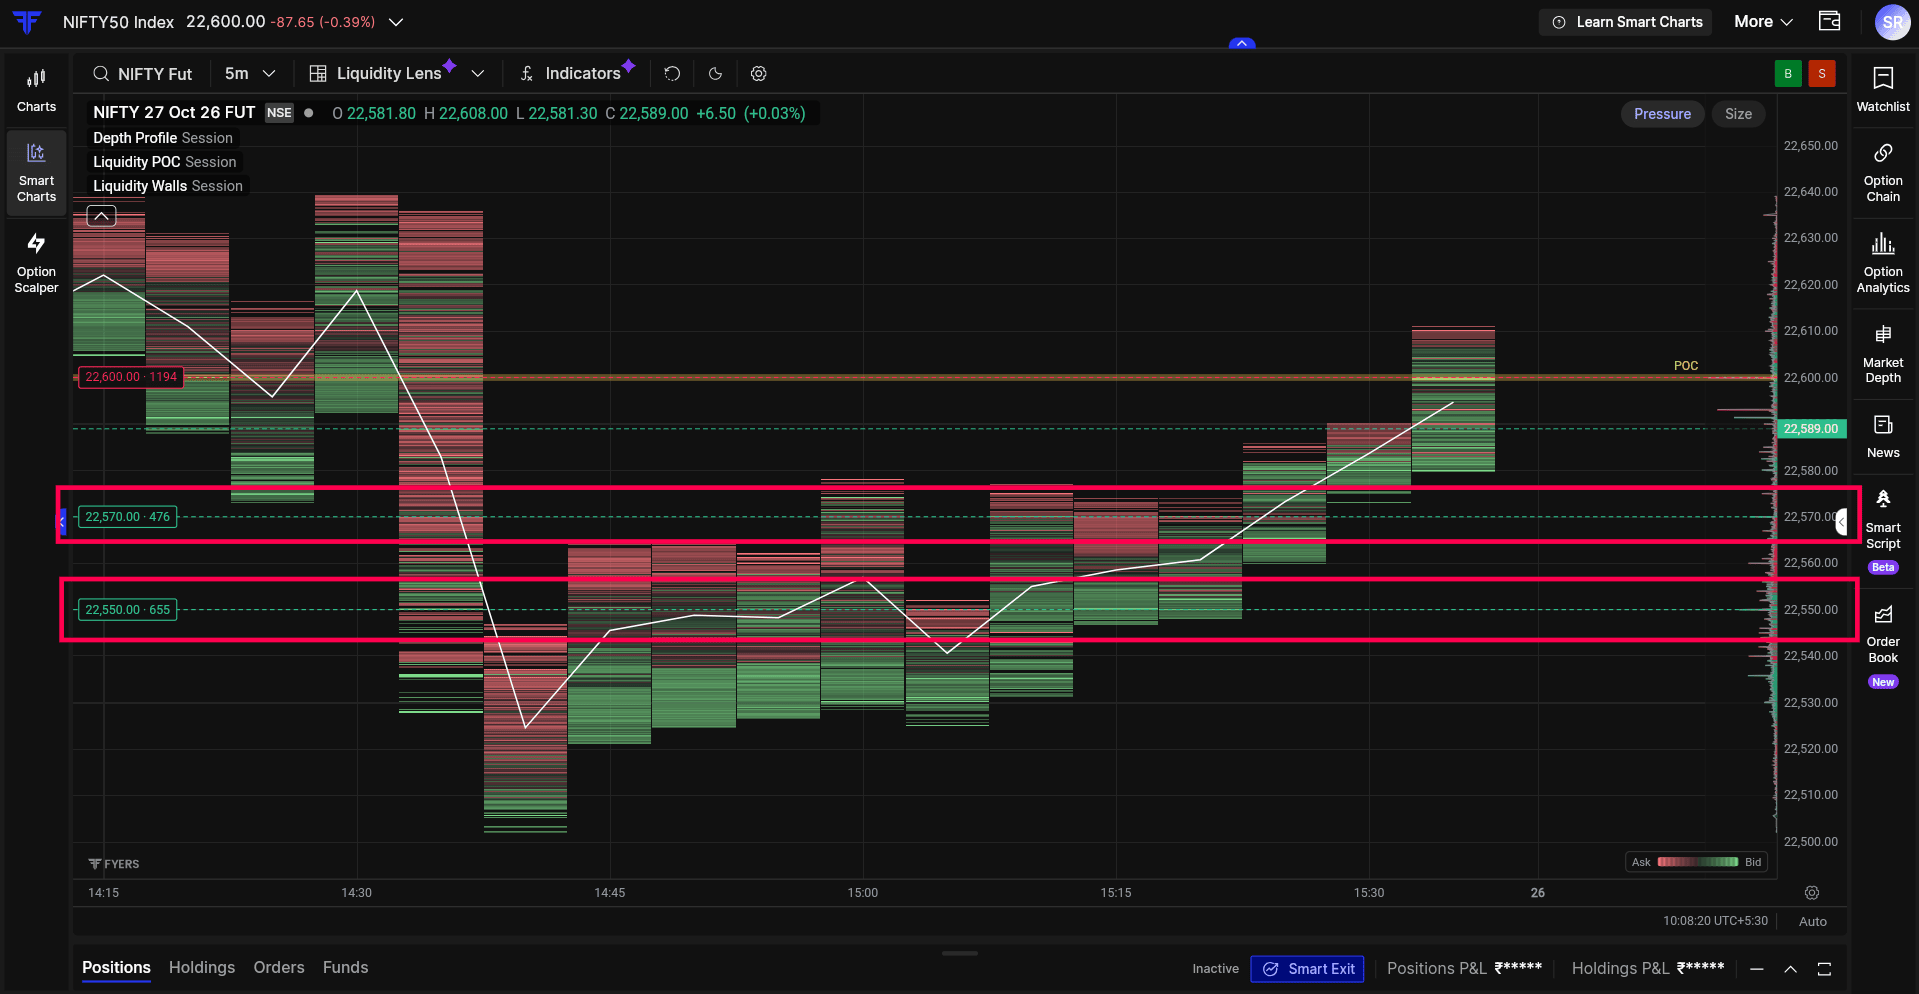
Liquidity Walls highlight price levels with significant average resting buy or sell quantities across the visible chart range. The markers display the price and resting quantity, helping you identify where substantial liquidity has been concentrated.
As liquidity levels change, these concentrations may become more or less prominent. While these levels can be useful to watch, they don’t guarantee that price will find support or resistance there.
Track Order Book Changes with Imbalance and Spread
Market Depth isn’t static. Resting buy and sell quantities change throughout the trading session, which means the balance between Bids and Asks can shift several times.
Book Imbalance: Understand the Balance Between Buyers and Sellers
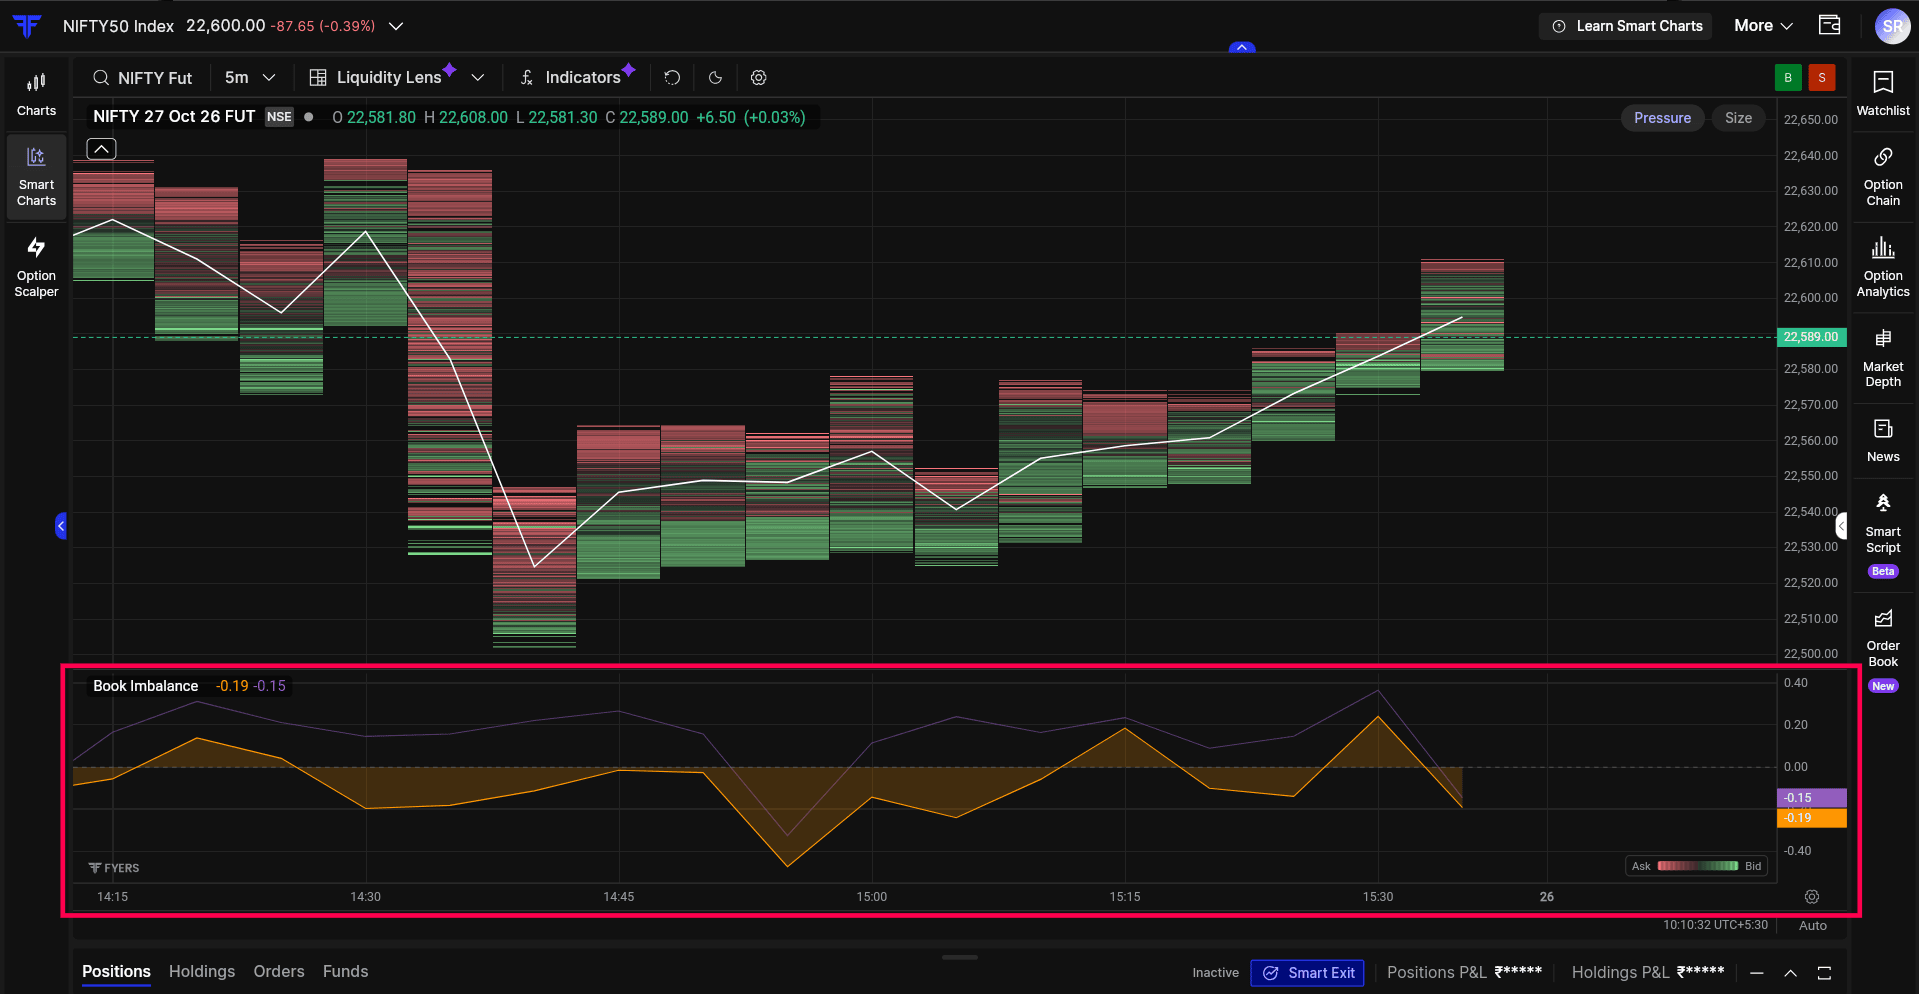
Book Imbalance shows how the balance between resting buy and sell quantities changes throughout the trading session. A positive reading indicates more quantity on the bid side, while a negative reading indicates more quantity on the ask side.
You’ll notice two lines on the indicator. The solid line represents the imbalance across all available price levels, providing a broader view of resting liquidity. The thinner, faded line represents the imbalance at best bid and ask prices alone, making it more sensitive to changes at those levels. Because they measure different portions of the order book, the two lines may move differently.
By following these readings on the chart, you can identify when the balance shifts between the two sides and observe how those changes develop alongside price movement. This is useful when you want to understand whether the resting quantities continue to favour one side or change as the market moves through different levels.
A positive or negative imbalance doesn’t necessarily indicate which direction price will move next. It simply shows how displayed liquidity is balanced at that point and how that balance changes over time.
Book Spread: Track the Gap Between Buying and Selling Prices
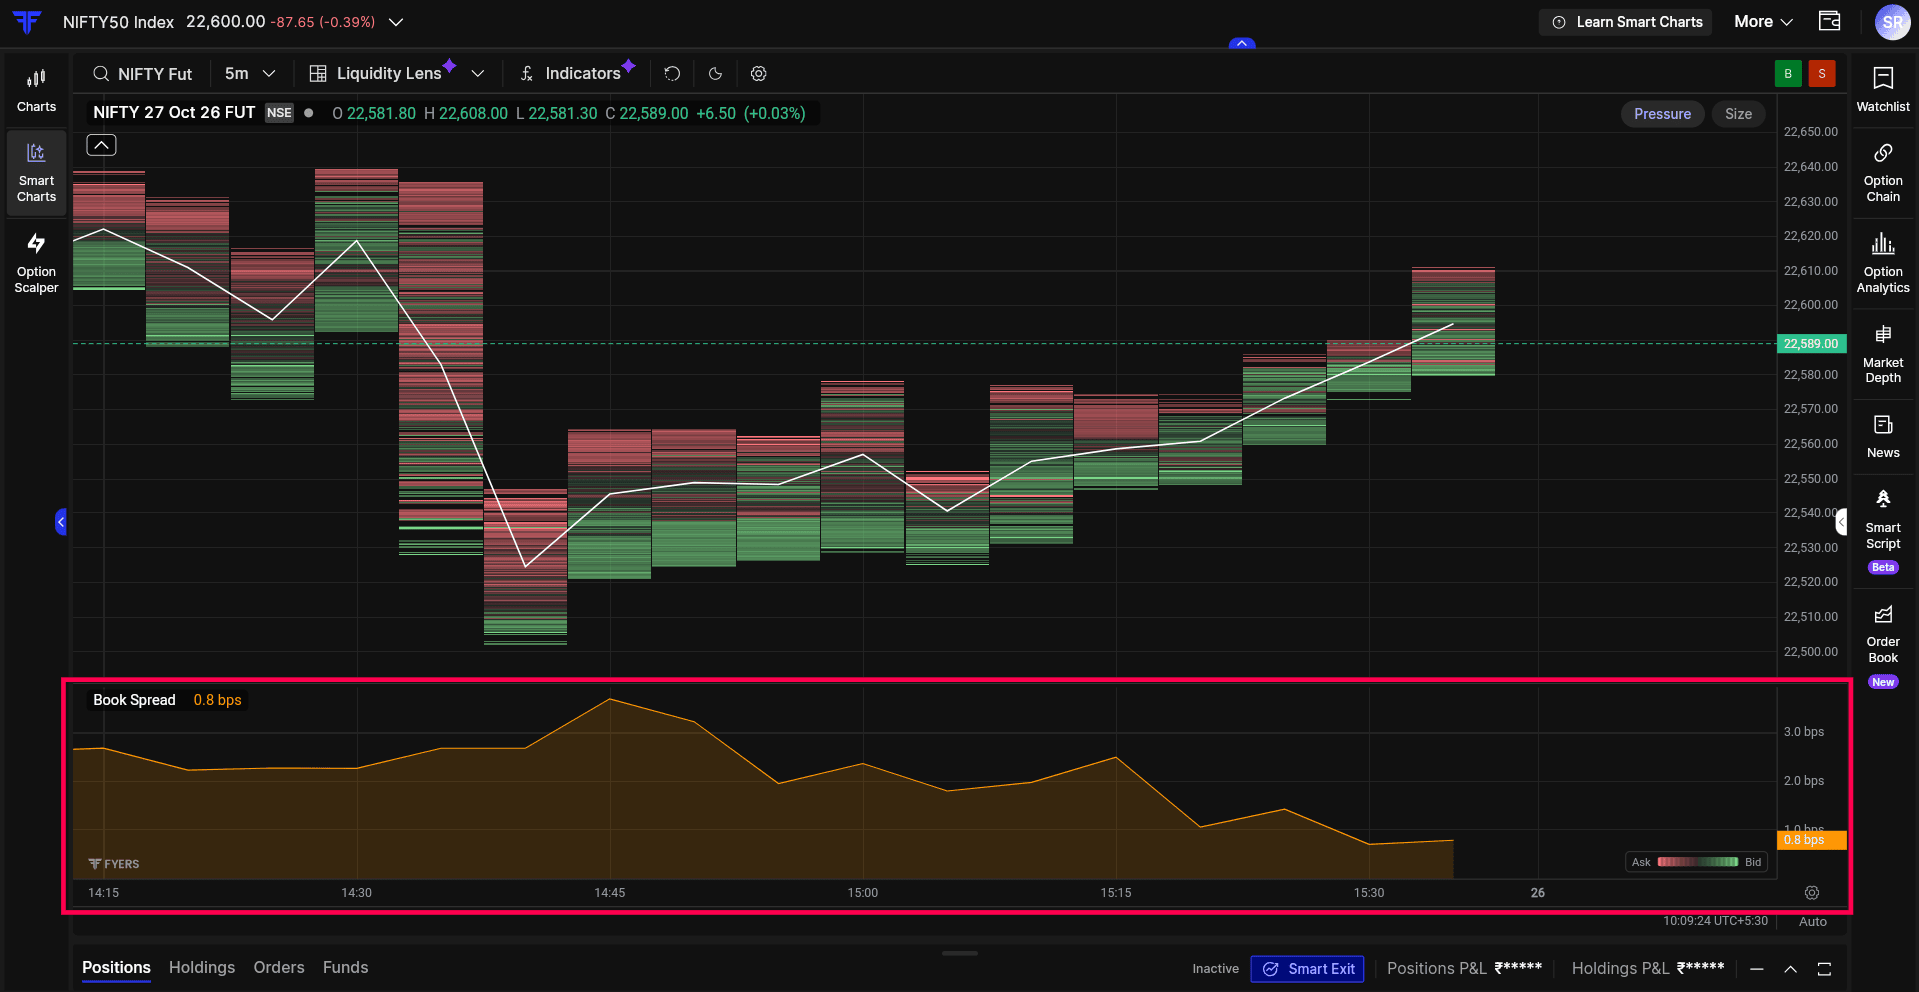
Book Spread tracks the difference between the best bid and best ask prices throughout the trading session. This gap can remain relatively narrow during normal trading activity or widen when market conditions change.
Basis points (bps) express the spread as a percentage of the midpoint between the Best Bid and Best Ask prices. One basis point equals 0.01%. For example, if the Best Bid is ₹99.95 and the Best Ask is ₹100.05, the spread is ₹0.10, or 10 bps.
This makes it easier to compare spreads across instruments with different prices. A lower bps value indicates a narrower spread relative to the price, while a higher value indicates a wider spread.
By following Book Spread over time, you can observe when the difference between buying and selling prices changes and whether the spread remains stable or fluctuates during the session.
This is worth tracking because the spread is one of the factors that can affect execution costs, particularly when placing market orders. Looking at these changes alongside current market depth gives you more context about the liquidity available when you’re entering or exiting a position.
For more details refer to this article.
Bringing the Different Views Together
Liquidity Lens brings different views of resting liquidity together, helping traders identify where orders are concentrated and how they change alongside price movements.
As we continue expanding the analytical capabilities of FYERS Smart Charts, Liquidity Lens adds another perspective to understanding price action and market liquidity.
Liquidity Lens is now available on FYERS Web through Smart Charts. Explore how liquidity builds and shifts around price, and share your experience in the comments below.