How is the concept of pivot points in conjunction with other indicators to enhance decision-making?
The pivot points is a pretty cool indicators! Basically, they’re calculated as the average of the previous day’s high, low, and close prices, and they can help you identify potential turning points for the price on the current day. You can even use pivot points with other indicators, like Fibonacci retracement, moving averages, and candlestick patterns, to make even better decisions. For example, you can use pivot points to confirm the trend direction, figure out when to enter and exit trades, set stop-loss and take-profit levels, and get a sense of the market sentiment. And if you want even more information, other indicators can help validate the signals generated by pivot points and give you more context.
1 Like
Price is above all and everything else is secondary. When we say secondary, there is no point in discussing about secondary things much. Lets say “PRICE” is king, and we as a trader are associated with KING, so there is no point in getting to know too much about other secondary things. Whatever indicators that a trader puts on his screen, always works when price starts working.
But everything said, association between indicators and price is always kind of different. Now if we take PIVOTS they just stand at one place and doesn’t predict movement, but for a keen trader pivot talks in a different language. For example, if mkt opens above PIVOT, then it is buy when chance presents itself vice versa if it opens below. If we consider RSI, it plays along the price all the time, but sometimes it argues with the price and gives off hidden messages to a keen eyed trader. Same with other indicators. Lot of efforts are need to understand the PRICE and indicators.
1 Like
Let’s keep it simple, according to me you require 3 factors to take a trade listing them below -
Trend - of the stock price
Momentum/Strength - whether it’s consolidating or not
Level - price to take action on
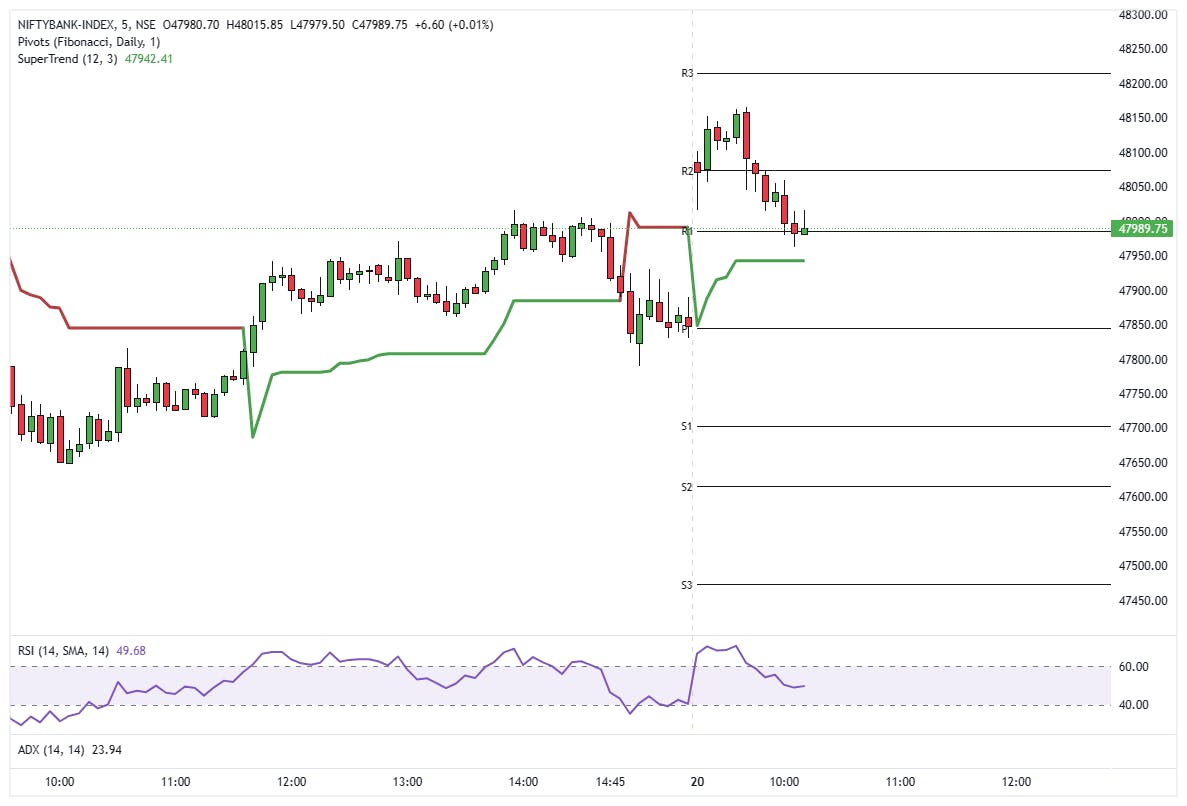
So, Pivot provides the Level to take action on, but you need to identify the Trend and Momentum. There are various indicators which serve this purpose but I personally prefer SuperTrend to identify trend and RSI to identify strength.
If price is above SuperTrend and RSI >= 60 and price crosses above Pivot then you can take longs.
If price is below SuperTrend and RSI <= 40 and price crosses below Pivot then you can take shorts.
I personally prefer Fibonacci Pivots rather than Camarilla but it’s up to you.
I’m assuming that you’re talking in context of intraday trading since you’re using Pivots, but if you are into positional trading then chart patterns work very well as compared to indicators.
1 Like