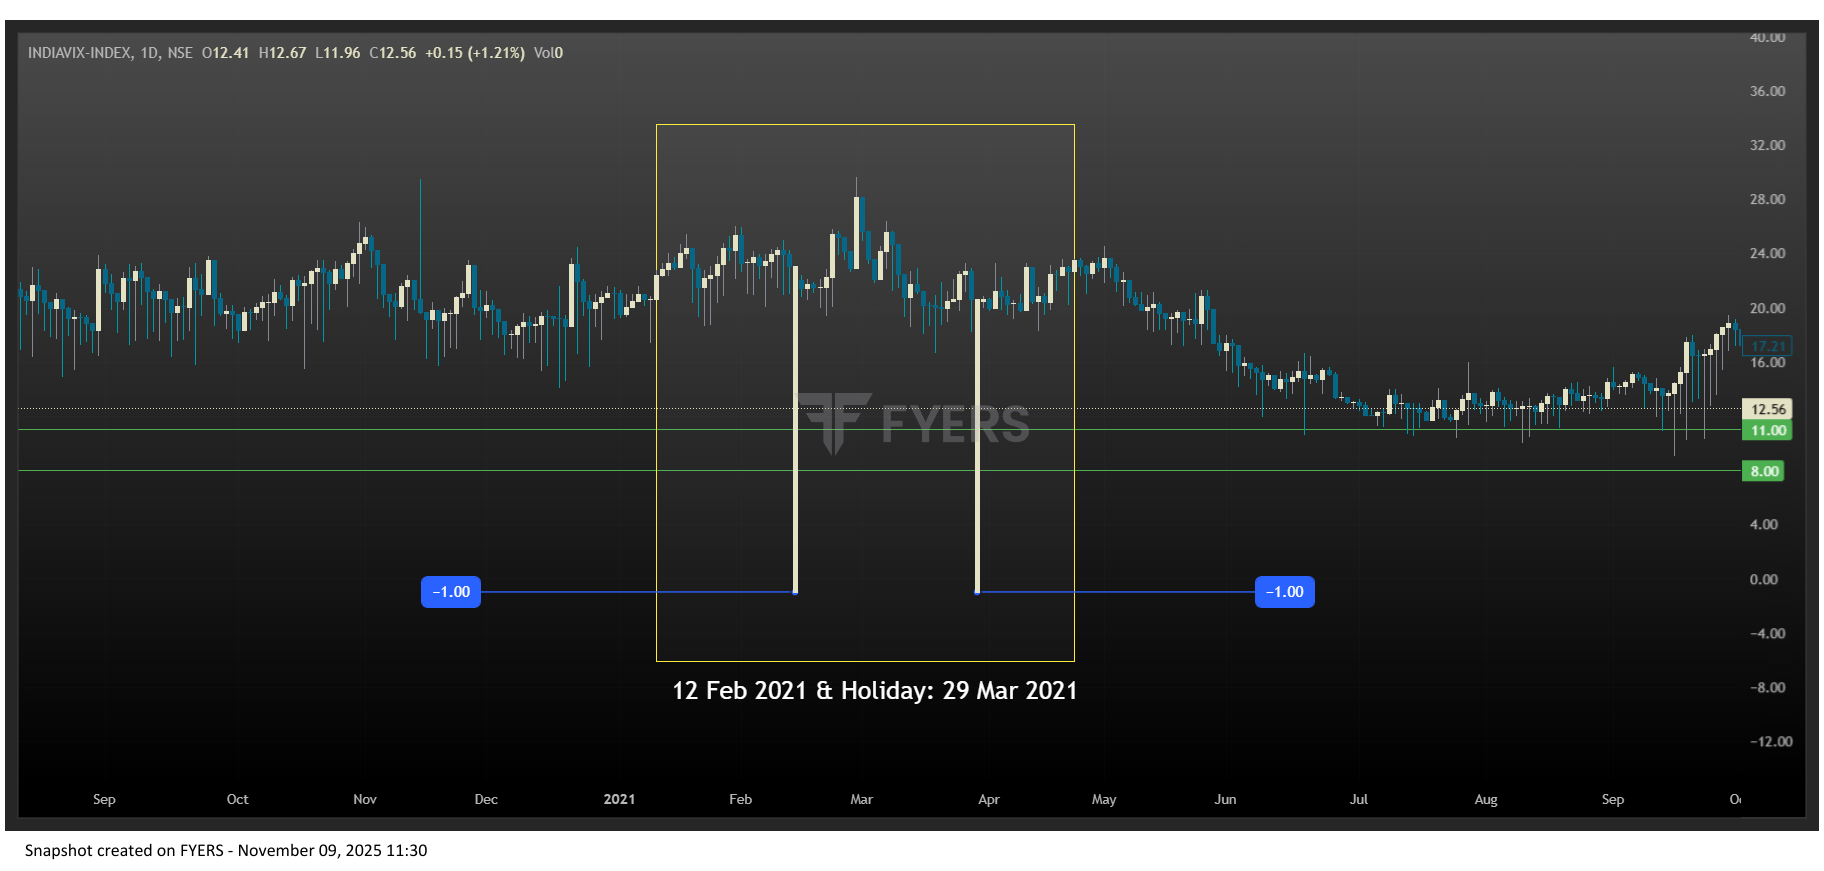
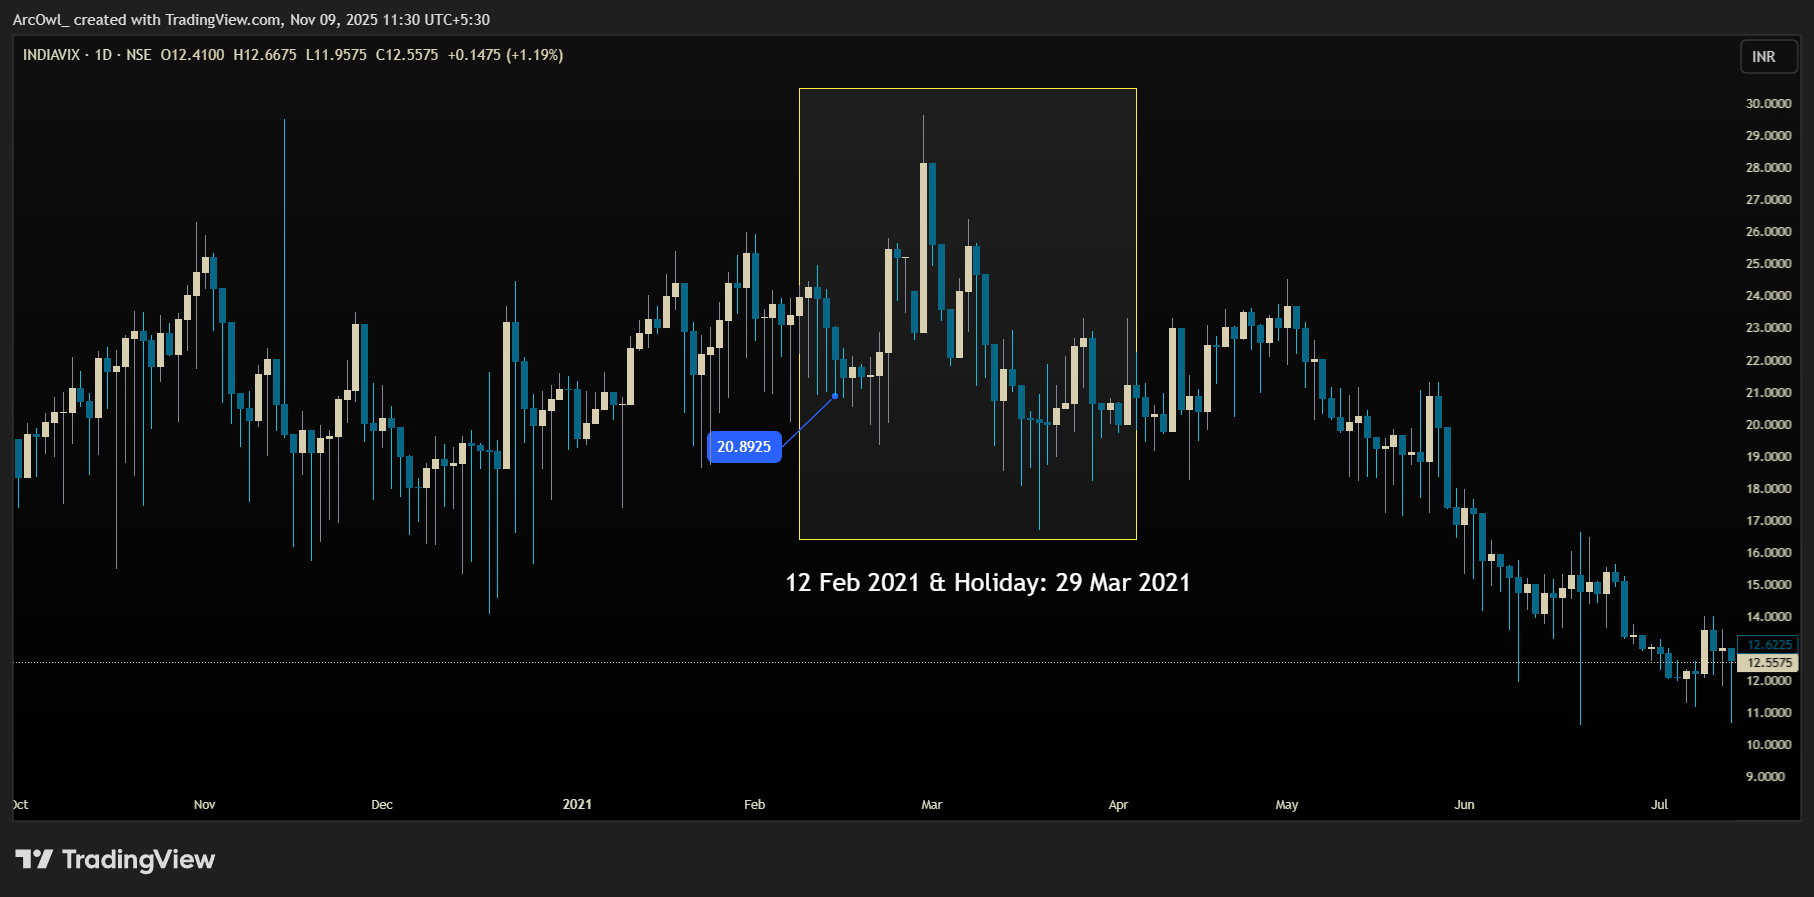
Hey , spotted a weird in your India VIX historical chart: Candle low at -1 on 12 Feb 2021 (flat market day) & even on Holi holiday 29 Mar 2021 (no trading!). Is this a data glitch? Accurate historicals are key for research—pls investigate & update!  .
.