Hi Team,
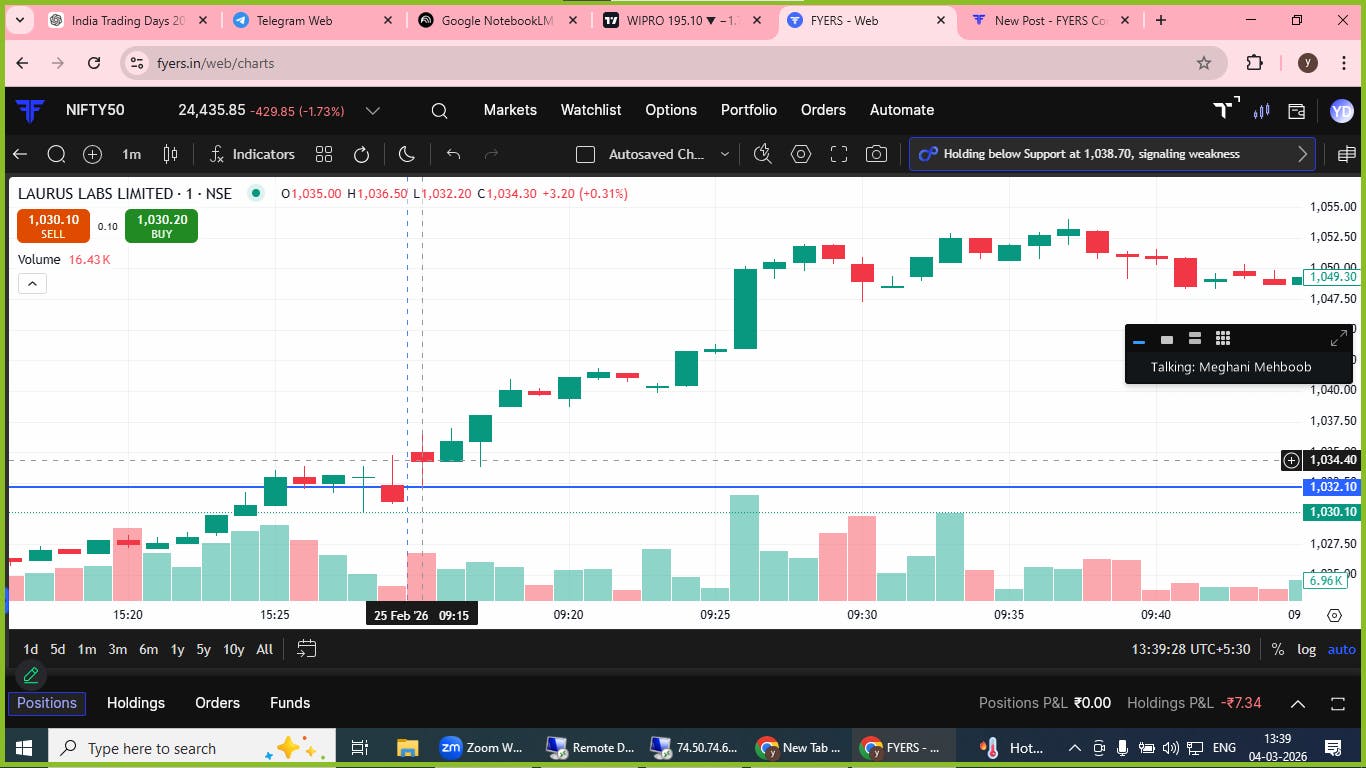
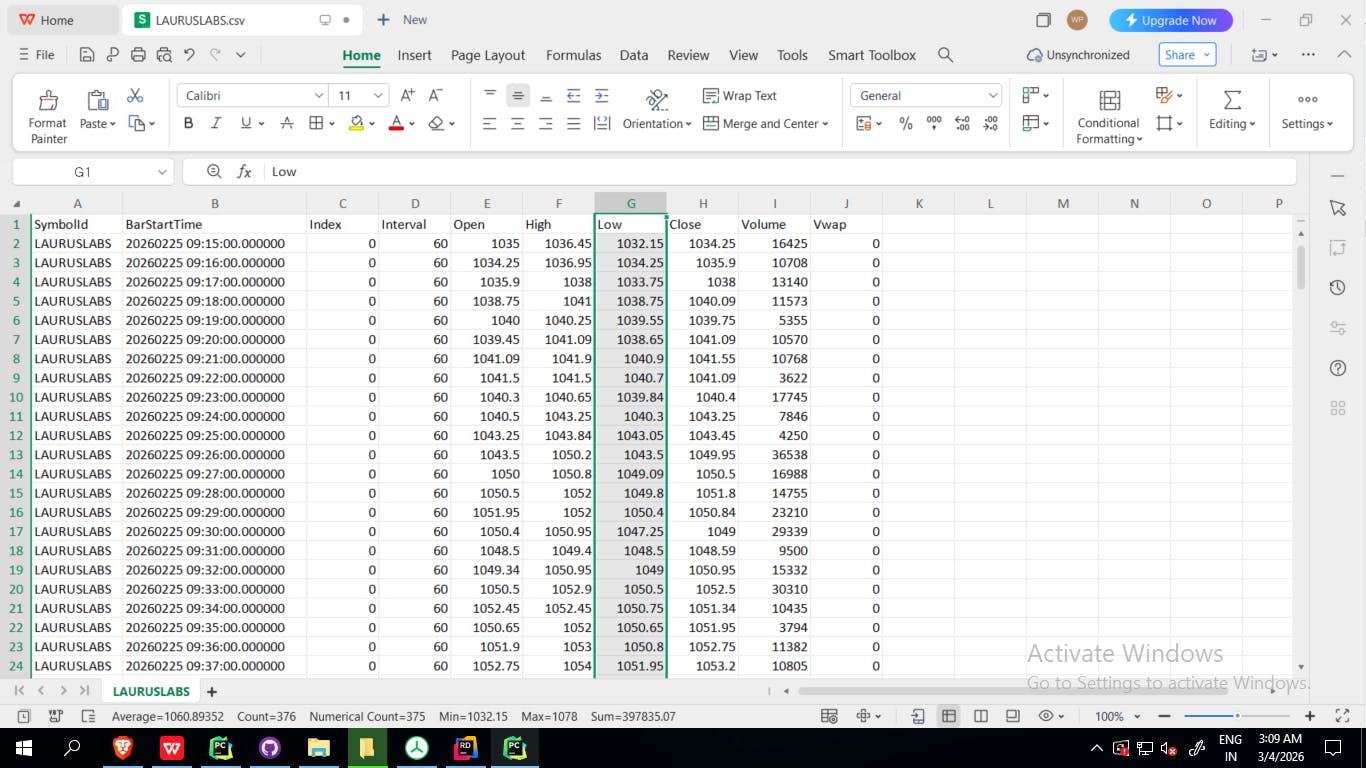
While downloading 1-minute historical data using the Fyers API, I noticed a small discrepancy between the API OHLC values and the values shown on the Fyers chart.
Symbol: LAURUSLABS
Date: 25 Feb 2026
Interval: 1 Minute
Bar Time: 09:15
API Data:
Open: 1035
High: 1036.45
Low: 1032.15
Close: 1034.25
Fyers Chart Data:
Open: 1035.00
High: 1036.50
Low: 1032.20
Close: 1034.30
Bar Time: 09:16
API Low: 1034.25
Chart Low: 1034.30
Bar Time: 09:17
API Low: 1033.75
Chart Low: 1033.80
There is a consistent ₹0.05 difference in some OHLC values.
This difference affects backtesting accuracy, so clarification would be very helpful.
Thank you.