You open a NIFTY chart looking for an intraday trading opportunity. Before you can form a view, there are a few things you would typically look at, from marking support and resistance to adding indicators and understanding the price action.
None of this is difficult on its own. But doing it repeatedly, every day or across different charts, is where things can get missed. A level you did not mark, a pattern you scanned past, or a shift in momentum you caught too late.
That is where FIA AI Actions can help. Start with a Quick Action to understand the price movement, mark the relevant levels and form your view. Then use the relevant FIA Trading Setup to go deeper and validate that view.If you trade options, FIA can also bring together key option-chain data such as OI, Max Pain, Greeks, volatility and positioning in one view.
Start with a AI Quick Action
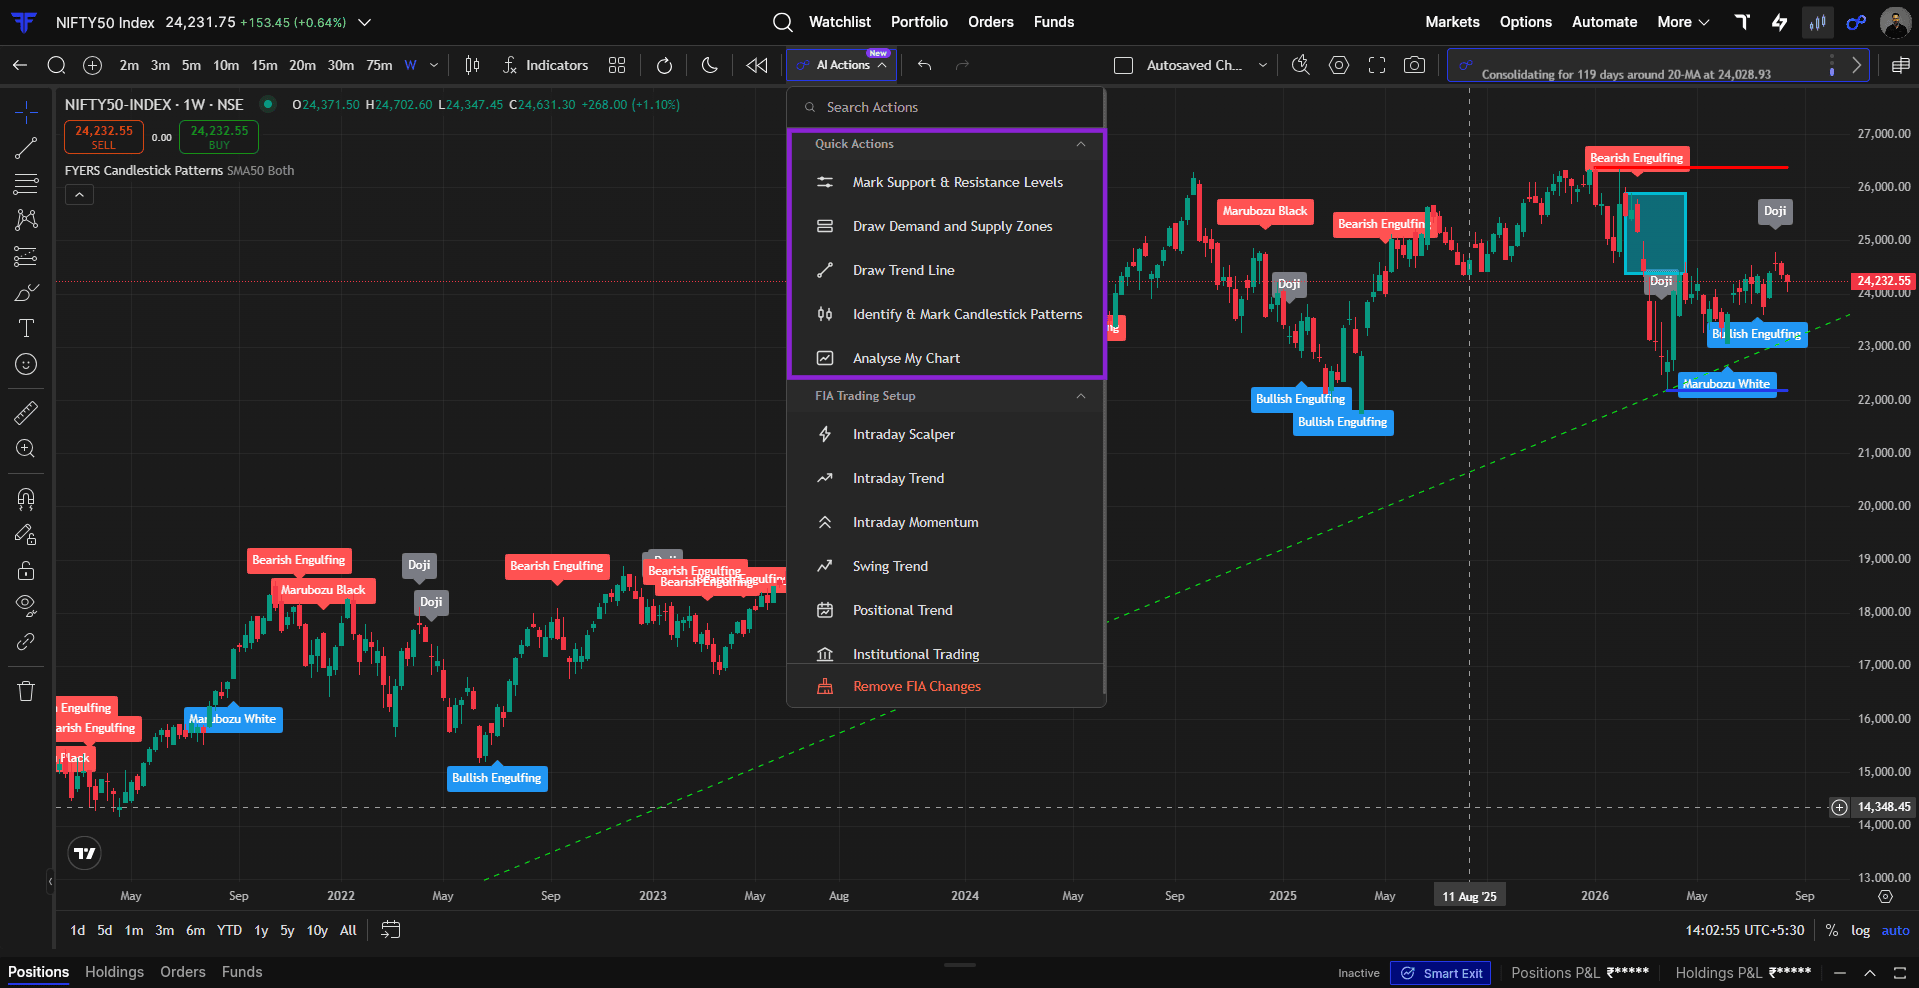
Sometimes you already know exactly what you want to check. You may only want the key support and resistance levels, or the trendlines drawn before you look for an entry. That is what Quick Actions are for.
From the FIA dropdown on FYERS Web, you can ask FIA to:
-
Mark Support & Resistance Levels to identify key price levels.
-
Draw Demand and Supply Zones to highlight areas of buying and selling activity.
-
Draw Trend Line to map the prevailing trend.
-
Identify & Mark Candlestick Patterns to spot relevant chart patterns.
-
Analyse My Chart for a broader view of the current setup.
FIA applies these directly to the chart, so you do not have to mark every level or drawing manually before you start analysing the setup.
FIA Trading Setup
Quick Actions work well when you know exactly what you want FIA to do. But sometimes you want the complete setup, not one specific task. That’s where FIA Trading Setup comes in. Choose the setup closest to how you trade, and FIA adjusts its analysis accordingly.
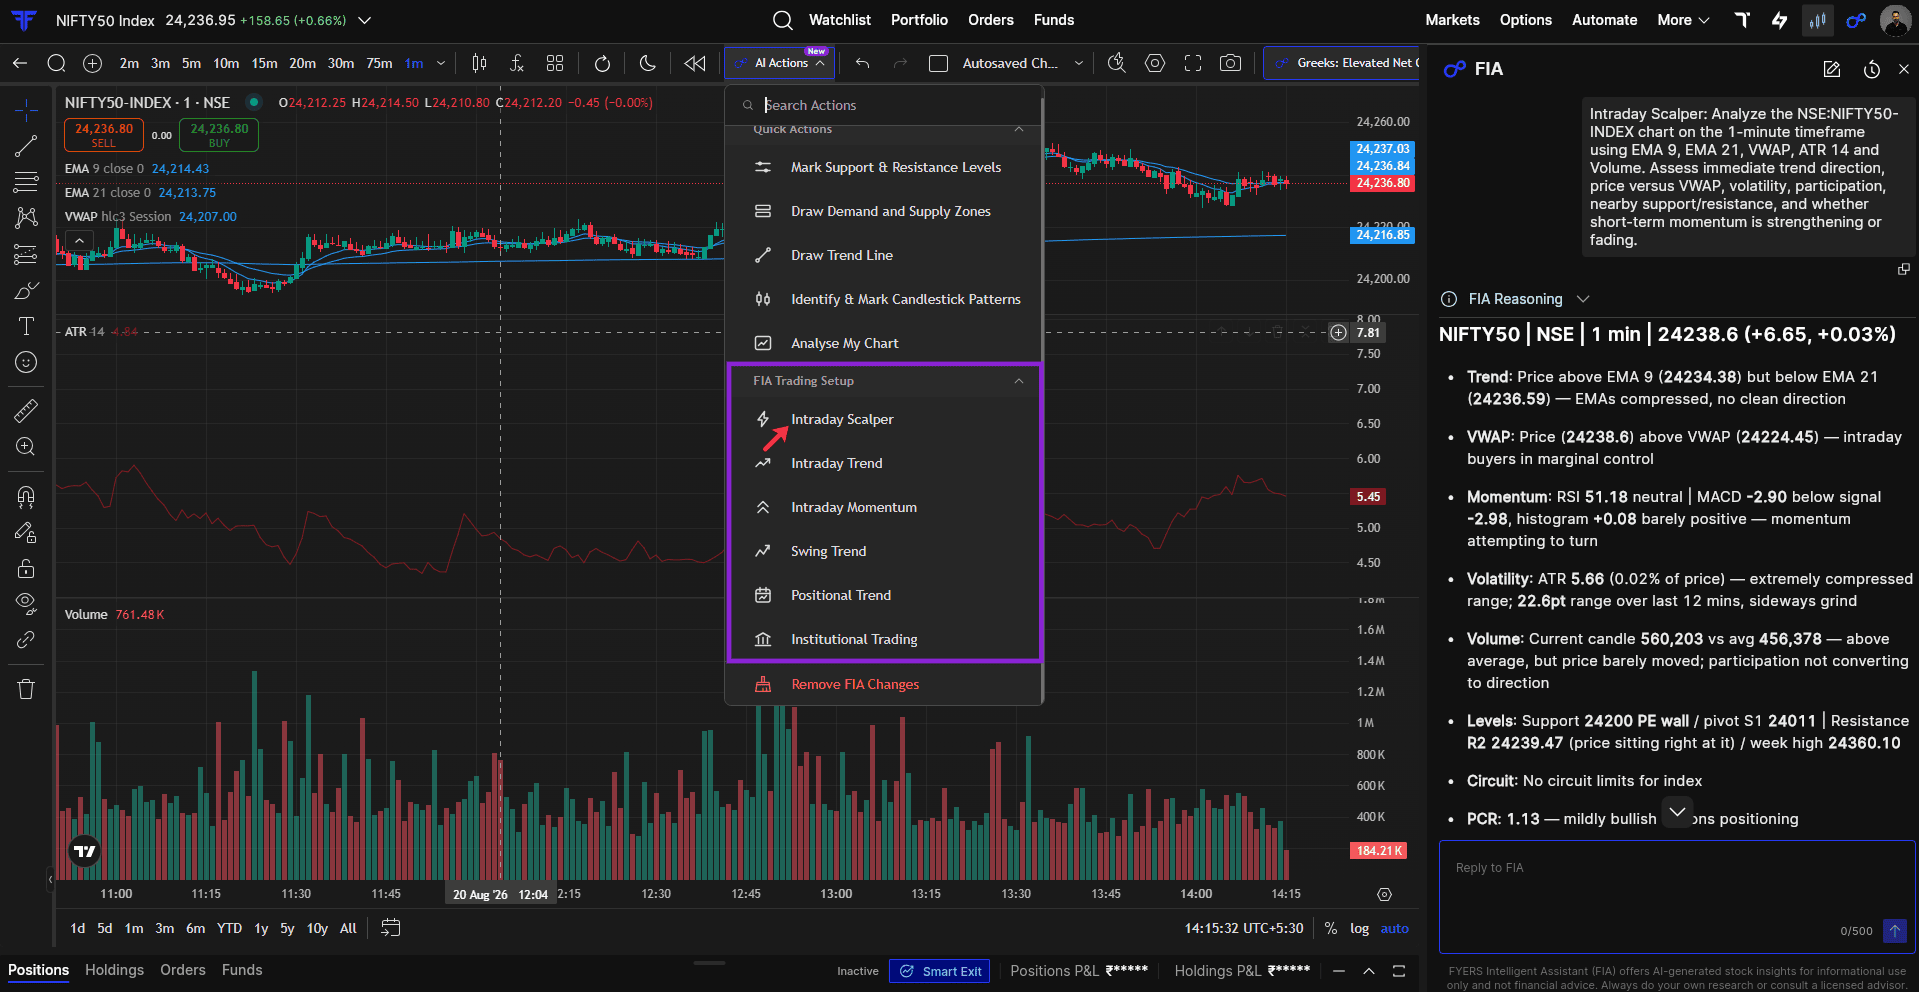
Say you’re looking at NIFTY for a quick intraday opportunity. Select Intraday Scalper, and FIA applies the indicators relevant to the setup, such as EMA 9, EMA 21, VWAP, ATR and volume, directly to the chart. It then analyses the setup across trend, momentum, volatility and key levels, with the reasoning shown alongside the chart.
You can currently choose from:
-
Intraday Scalper: analyses immediate price action for quick entries and exits.
-
Intraday Trend: evaluates the current intraday trend and its continuation.
-
Intraday Momentum: assesses the strength of the current move and whether momentum is holding.
-
Swing Trend: looks at the broader trend for opportunities that can play out across sessions.
-
Positional Trend: evaluates the larger trend for longer-duration setups.
-
Institutional Trading: analyses the chart through broader price structure and institutional activity.
The distinction is straightforward: with Quick Actions, you choose what you want FIA to do on the chart. With FIA Trading Setup, you choose the context FIA should use to analyse it.
Remove FIA Changes
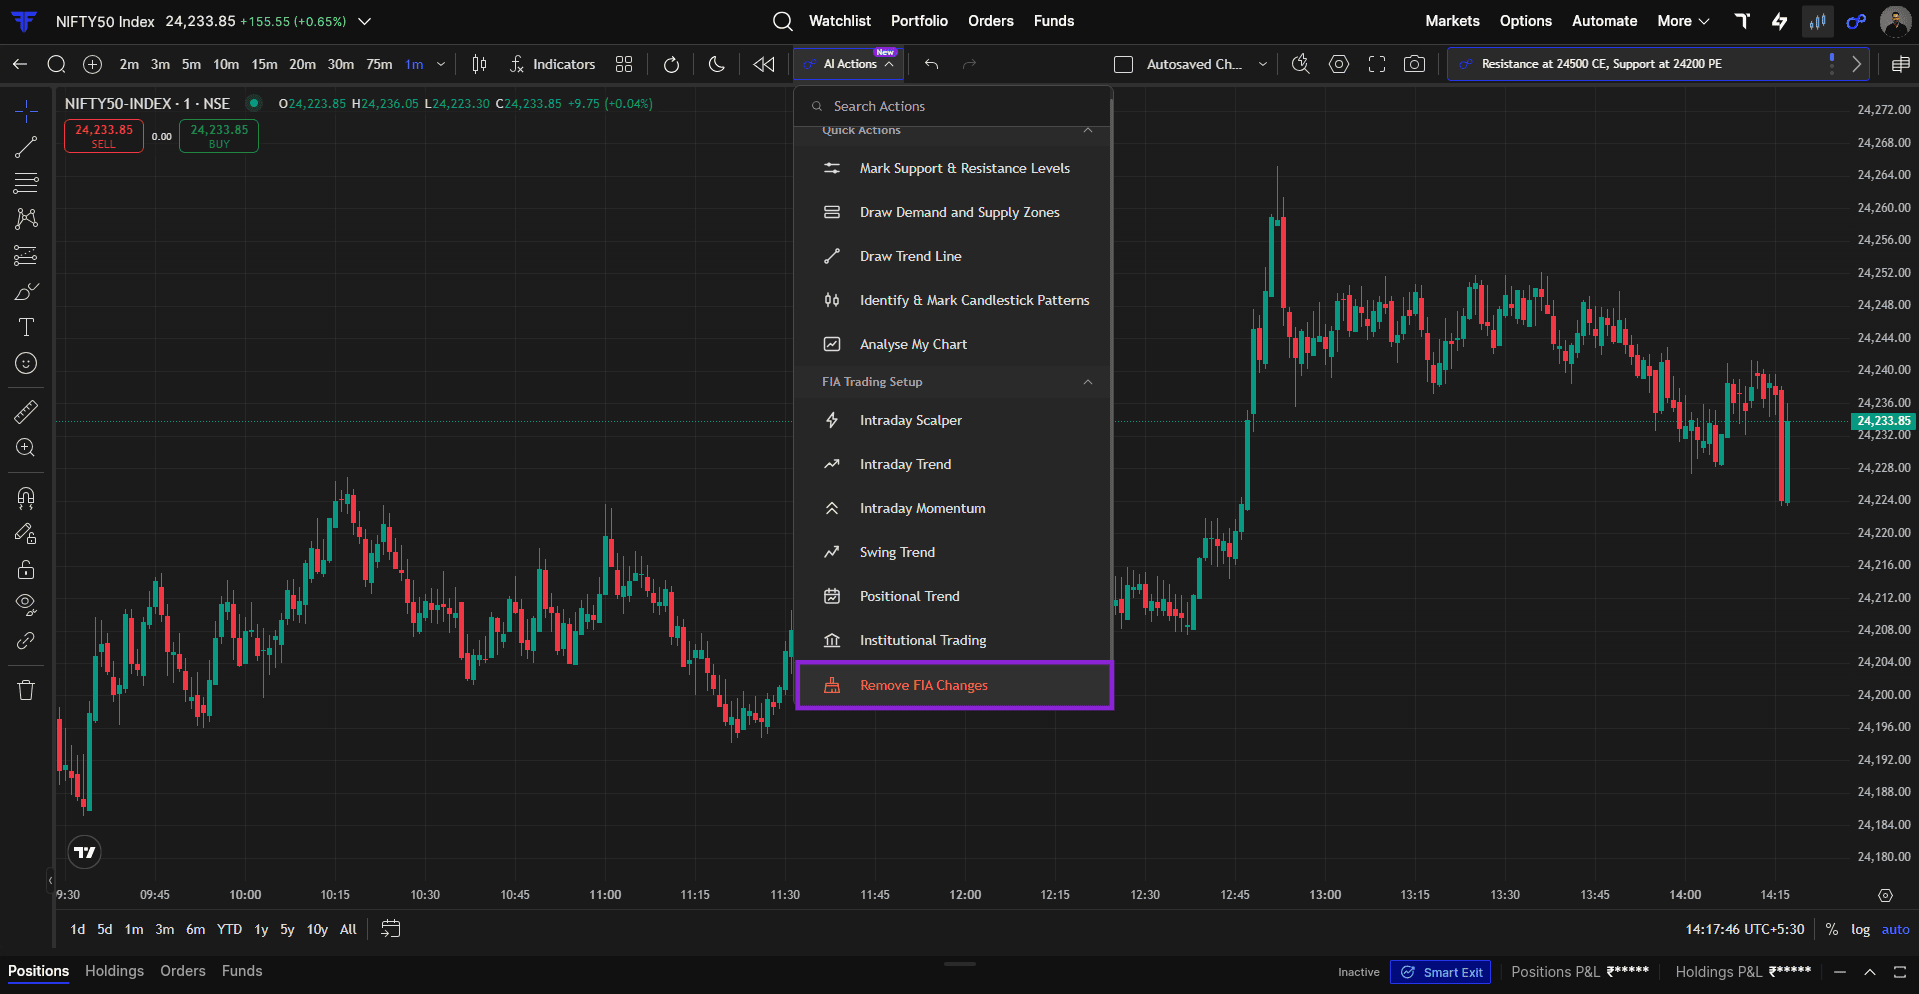
You can experiment with FIA without losing the work you’ve already done on your chart. If FIA has added drawings or indicators you no longer need, select Remove FIA Changes. FIA clears what it added while leaving your own chart drawings untouched, so you can try an action, compare FIA’s view with your own and clear it whenever you want.
Advanced Option Analysis
Charts are only one part of the decision for an options trader. You are also looking at where OI is building, which strikes writers are defending, where Max Pain is sitting, how IV is behaving, what the Greeks are indicating and what range the market is pricing into expiry.
The data is already there in the option chain. The harder part is connecting it.
That is what FIA Insights helps with. On the App, you can open FIA Insights from Option Chain, Option Analytics or Symbol Details and bring those data points together in one analysis.
Take NIFTY trading around 24,232. FIA Insights shows fresh call writing around 24,600 and fresh put writing around 24,200, giving you a view of where the ceiling and floor may be forming. It also shows Max Pain around 24,250, close to the spot price. Each data point is useful on its own, but FIA Insights brings them together so you can understand how traders are positioned without piecing through the option chain yourself.
Depending on how much detail you need, you can use:
-
Quick Analysis for a quick read of the option chain.
-
Detailed Analysis for a deeper view of the data.
-
Buyers vs Writers to understand positioning on both sides.
-
ATM Greeks Analysis to assess key Greeks around the ATM strike.
Try FIA on Your Next Setup
Try AI Actions on FYERS Web with a NIFTY, Bank Nifty or stock chart you already follow. If you trade options, open FIA Insights on the App and compare its observations with the way you normally read the option chain. That is the easiest way to see where FIA fits into your own process.
You can explore FIA and its features in more detail through our FIA Support articles. And keep sharing your feedback with us. How you use FIA in real market conditions helps us understand what is useful, what we can improve and where we should take FIA next.