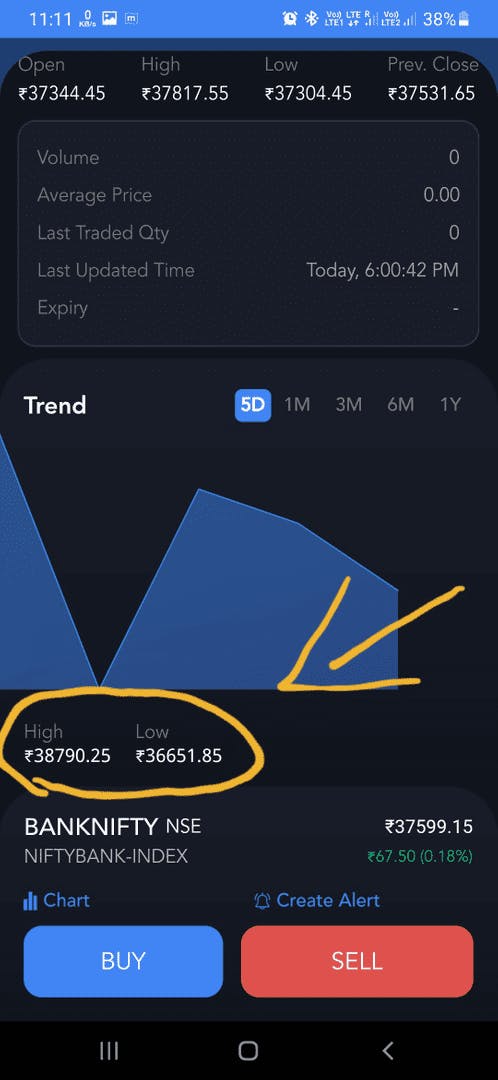
It is showing the high and low made in last 5 trading days.
On 15th February it made a low of 36,651 and it made a high of 38,790 on 11th February.
1 Like
Hi @uvAbJxr4AW,
As mentioned by @mahesh_kumar_ambati, the marked data is the High & Low of the previous 5 trading days. If you select the Trend as 1M, it will show the High & Low of the previous one month’s trading period.
Hope this addresses your query!
1 Like
Yes, thank you Vanshika Singh
Thank you Mahesh Kumar