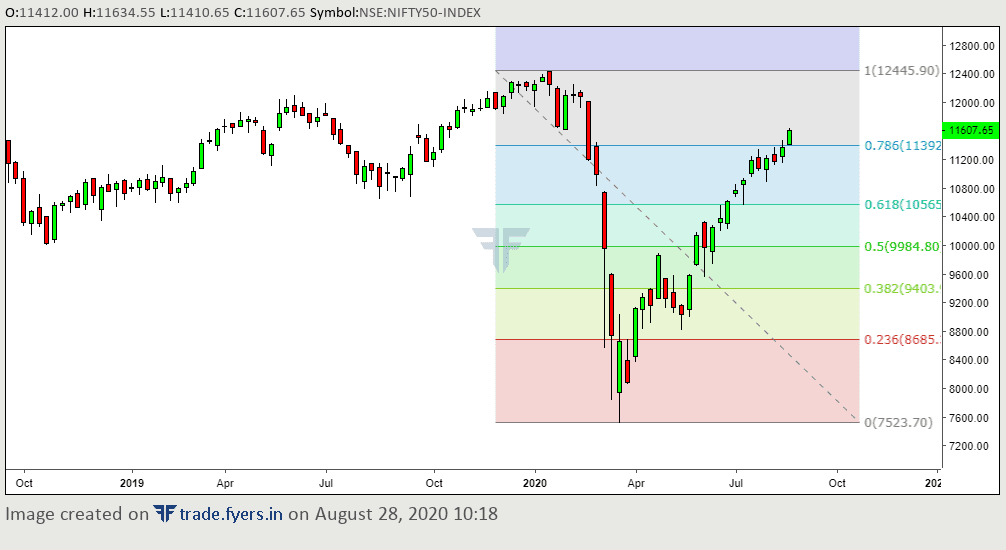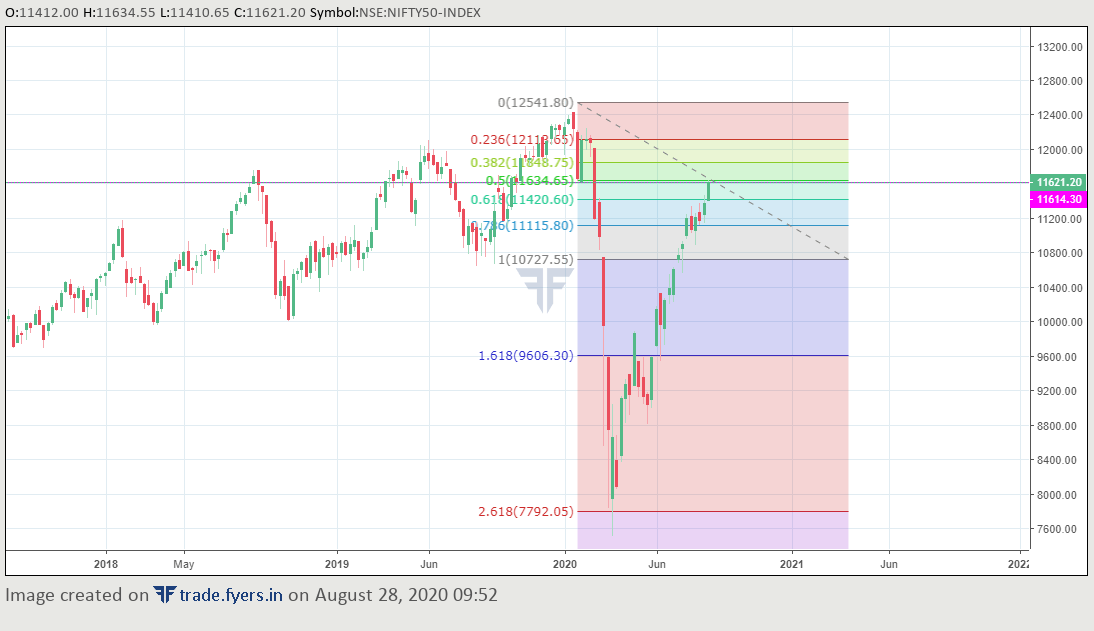
11634.65 acts as resistance.
What is today’s high?
It is 11634.55
Amazing isn’t it?
What you think Nifty from here?
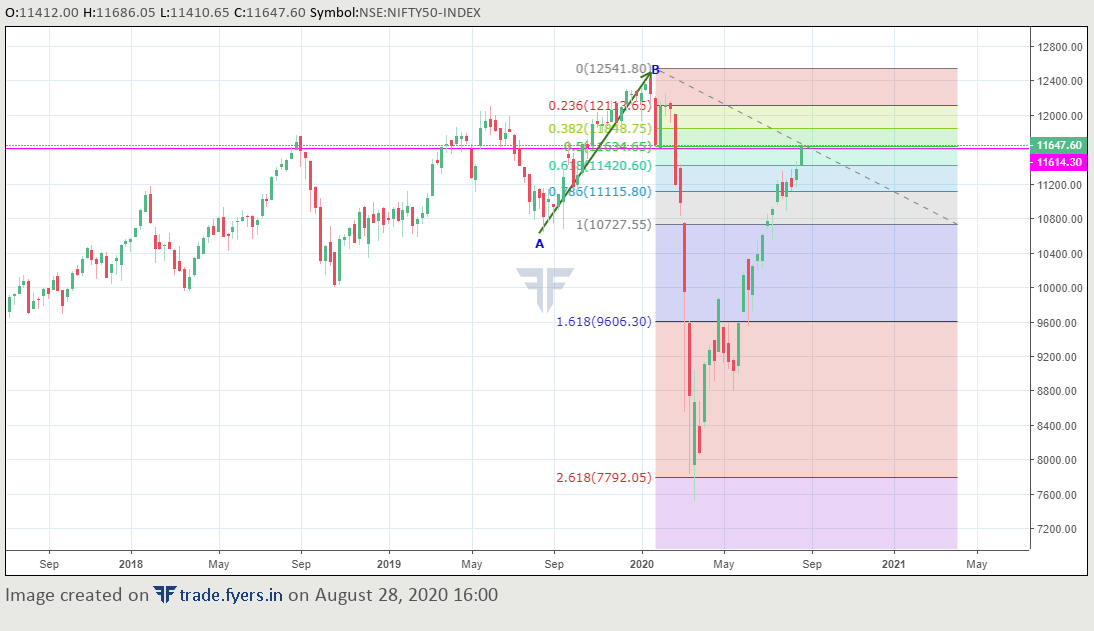
Break the resistance and head towards 11848 or will face resistance and get back to 11420 and 11115 levels in the coming week.
11634.65 acts as resistance.
What is today’s high?
It is 11634.55
Amazing isn’t it?
What you think Nifty from here?
Break the resistance and head towards 11848 or will face resistance and get back to 11420 and 11115 levels in the coming week.
Sir, I think you have plotted Fibonacci extension which is used to predict target levels, even though it contains retracement levels.
According to this, you were supposed to predict your Golden Ratio (https://www.mathsisfun.com/numbers/golden-ratio.html**) **target point of 9606.30 and of course, 2.618 extension at 7792.05 for going short.
This could be a way of plotting the Fibonacci retracement from peak to peak. This shows the NIFTY weekly chart.
So, according to the Fibonacci retracement levels, the next resistance is only at 12445. 
PS: Also have a look at this. https://community.fyers.in/post/is-nifty-going-for-another-fall-5f43fe0a0fa79c5186464d4c
No, I have plotted only fib retracement. I have taken Aug19th low to the Nifty high. Then shifted the drawing to the right side.
Thanks for sharing this. It is very useful.
Yes Sir.
But if u plot the retracement from a low point to a high point, isn’t it supposed to show how much the price will/has retraced from the high point towards the low point and vice versa.
Please have a look at this https://www.investopedia.com/articles/active-trading/091615/how-set-fibonacci-retracement-levels.asp
I have always loved the Fibonacci series (it is Indian Vedic in origin btw). But have never been able to plot it properly. It takes some mastery to find the entry point to plot and for me it has always been a subjective thing.
It is a very powerful method and I have great respect but it is due to my shortcomings I have never been able to use it.
I don’t trust Fib retracement as it gives no real benefits. Simple Horizontal Support Resistance works far better.
In my opinion, as far as plotting Fibonacci levels are concerned, you plot the Fibonacci retracement between two extremes (a high and a low) to predict the areas where a reversal might happen.
The same way, the Fibonacci extension will help you find the possible target levels with the same extremes.
For example,
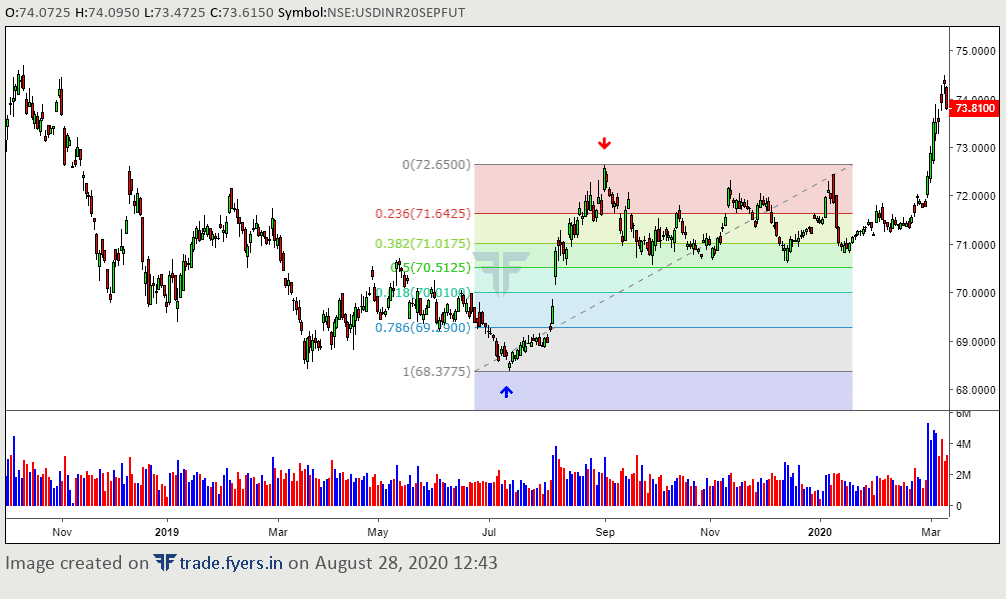
Consider this daily chart of USDINR. To find at which point after the high has been made, I should enter the trade to go long, you plot the Fibonacci retracement from the low to high.
As you can see, most reversals happen around 0.382 levels, so one possible strategy could be to enter at 0.382 levels by keeping a stop loss below 0.5 level, which is the nearest support level.
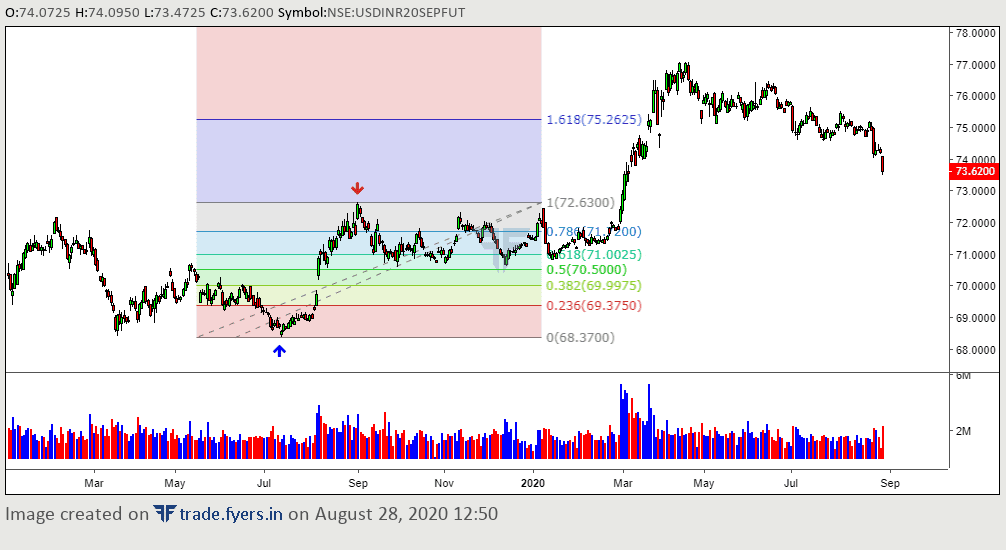
Now, with the help of the Fibonacci extension, you can find your target level which is mostly the golden ratio at 1.618.
You might exit a portion of your position here at 1.618 and remain in the trade with the next target of 2.618 by keeping a trailing stop-loss below 1.618 levels.
Make sure that you don’t take the levels given by both the indicators to be the same.
The levels shown in the Fibonacci retracement indicate how much the price will/have retraced from the final point.
The same way, the levels shown in the Fibonacci extension indicator shows how much it has extended from the point of origin.
I have drawn the fib retracement from Point A to Point B.
From point B that is all time high of Nifty. From there it retraced 23.6%, 38.2%, 50%, 61.8%, 78.6%, 100%, 161.8% 261.8% levels.
What I did was I shifted the point A position of fib drawing to the right side of the chart.
Now I am able to see the upward movement too.
So while it reversed, I have not redrawn the fib levels again.