When you open a stock, its price is usually the first thing you check.
You may want to see how it is moving today, whether it is trading near a recent high or low, or how it has performed over time. As you continue analysing it, you may also want to understand the company’s financial performance, study its technicals, compare it with similar businesses, track changes in shareholding, or review recent corporate updates.
Symbol Details on FYERS brings these different views together for the selected stock.
You can begin with a quick overview and then continue into detailed charts, technicals, fundamentals, shareholdings, corporate details, F&O data, and news without searching
Start with the Overview
The Overview brings together the information you may want to check first before studying a specific area in detail.
Analyse Price Movement with Price Chart and Price Analysis
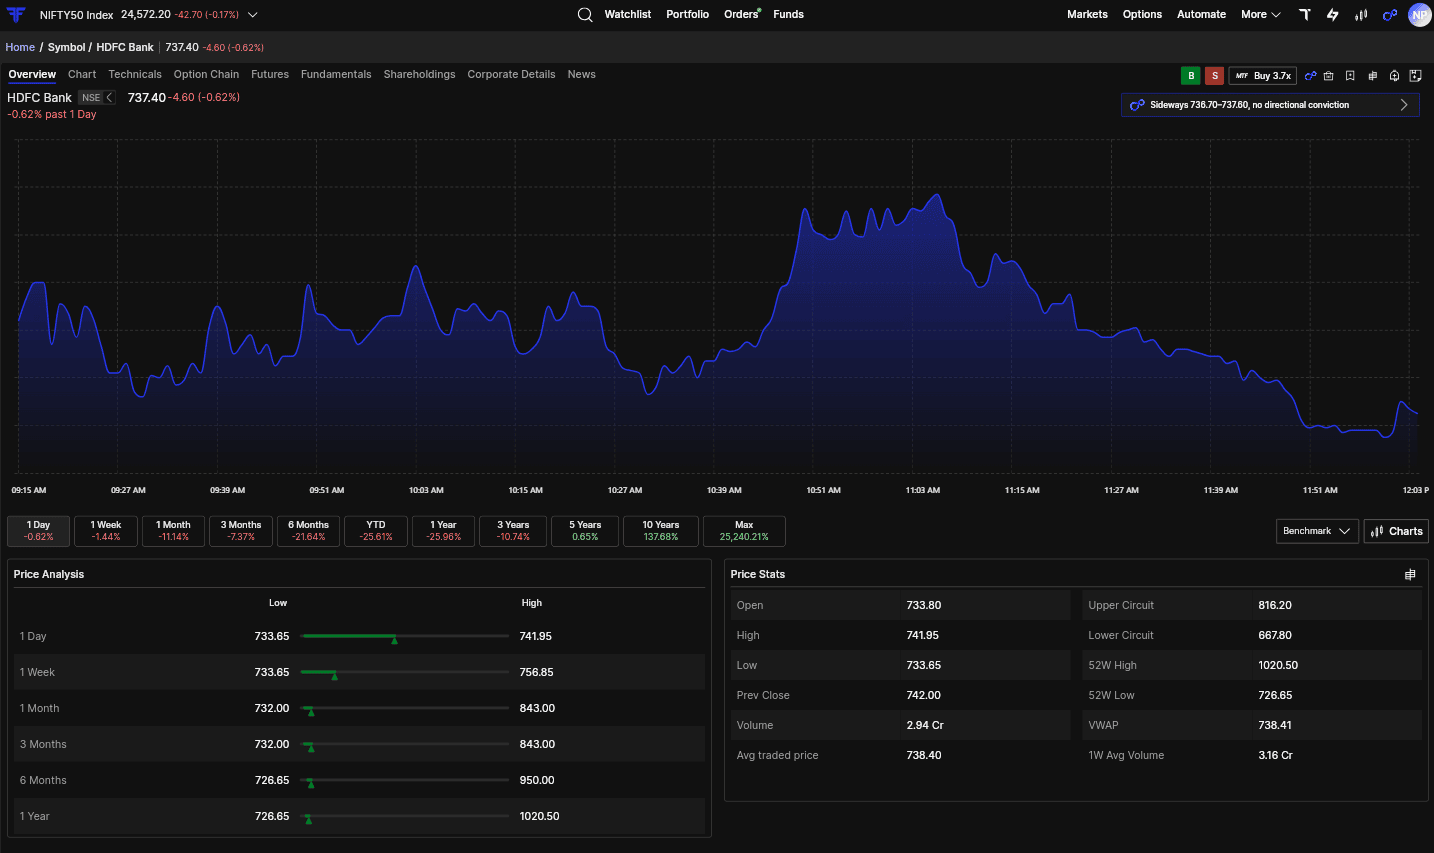
The Price Chart shows how the stock has moved during the trading session. Along with the current price and daily change, you can switch between different periods to see whether the movement is limited to the current session or part of a broader trend.
A technical observation may also appear above the chart, drawing attention to a relevant development in the stock’s price movement. When you want to study the setup in greater detail, you can open the complete chart directly from this section.
Price Analysis adds context by placing the current price within its range across different periods. A stock may be positive for the day while still trading well below its monthly or yearly high.
The supporting Price Stats show how the session has developed through information such as the open, high, low, previous close, volume, average traded price, VWAP, circuit limits, and 52-week range.
Understand the chart with FIA
Need help reading this chart? Use FIA to understand price action, identify key trends, and get context behind market movements all without leaving the chart.
Understand the Business with Snapshot
Once the price has your attention, you can look at the company behind it.
Snapshot gives you a quick view of the business, the sector it operates in, and its overall size. The Key Ratios section presents important financial measures that show how the company is valued, how profitable it has been, and how its business has grown.
You can also customise Key Ratios to display the metrics that matter most to your analysis. This keeps the section focused on the information you check most often.
When you need a more detailed view, you can open Fundamentals to explore the company’s financial history across more than 20 years.
Evaluate the Business with SWOT Analysis
A company may appear strong on some financial measures while showing concerns in others.
SWOT Analysis organises available observations under Strengths, Weaknesses, Opportunities, and Threats. You can move between the four sections to review developments related to profitability, growth, valuation, cash flow, and other available company information.
This gives you a structured way to look at factors that may support the business and areas that may require closer attention.

Benchmark the Company with Similar Companies
A company’s valuation or profitability becomes more meaningful when compared with similar businesses.
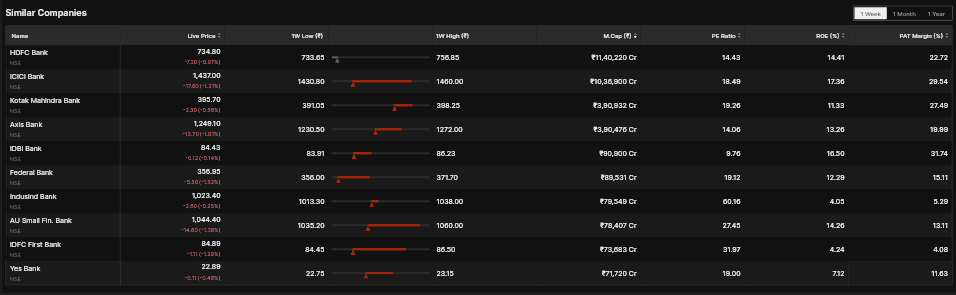
Similar Companies places the selected stock alongside its peers, making it easier to compare their size, valuation, profitability, and recent price performance without opening each company separately.
You can also switch between different periods to see how the selected stock has performed relative to its peers.
Analyse Historical Trends with Seasonality Insights
The same stock can behave differently across months and quarters.
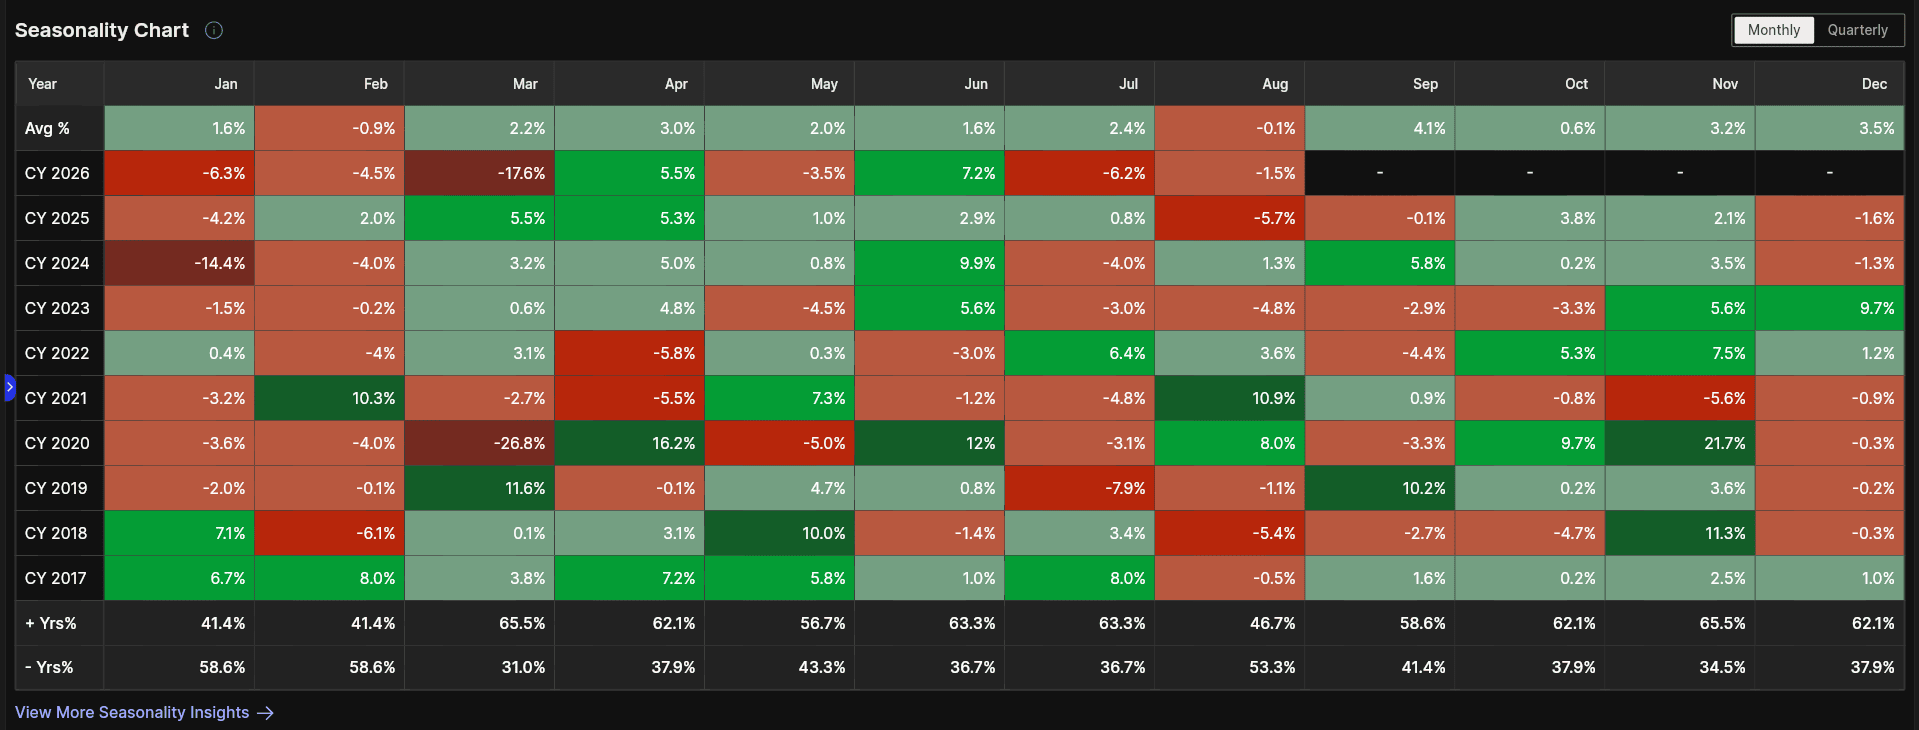
The Seasonality Chart shows how the stock has performed during different periods in previous years. You can review the average return for each month or quarter, compare performance across individual years, and see how often the stock ended the period positively or negatively.
These patterns are based on historical performance and do not predict future returns. For a more detailed view, you can continue to Seasonality Insights from the same section.
Explore Trading Ideas with Strategies
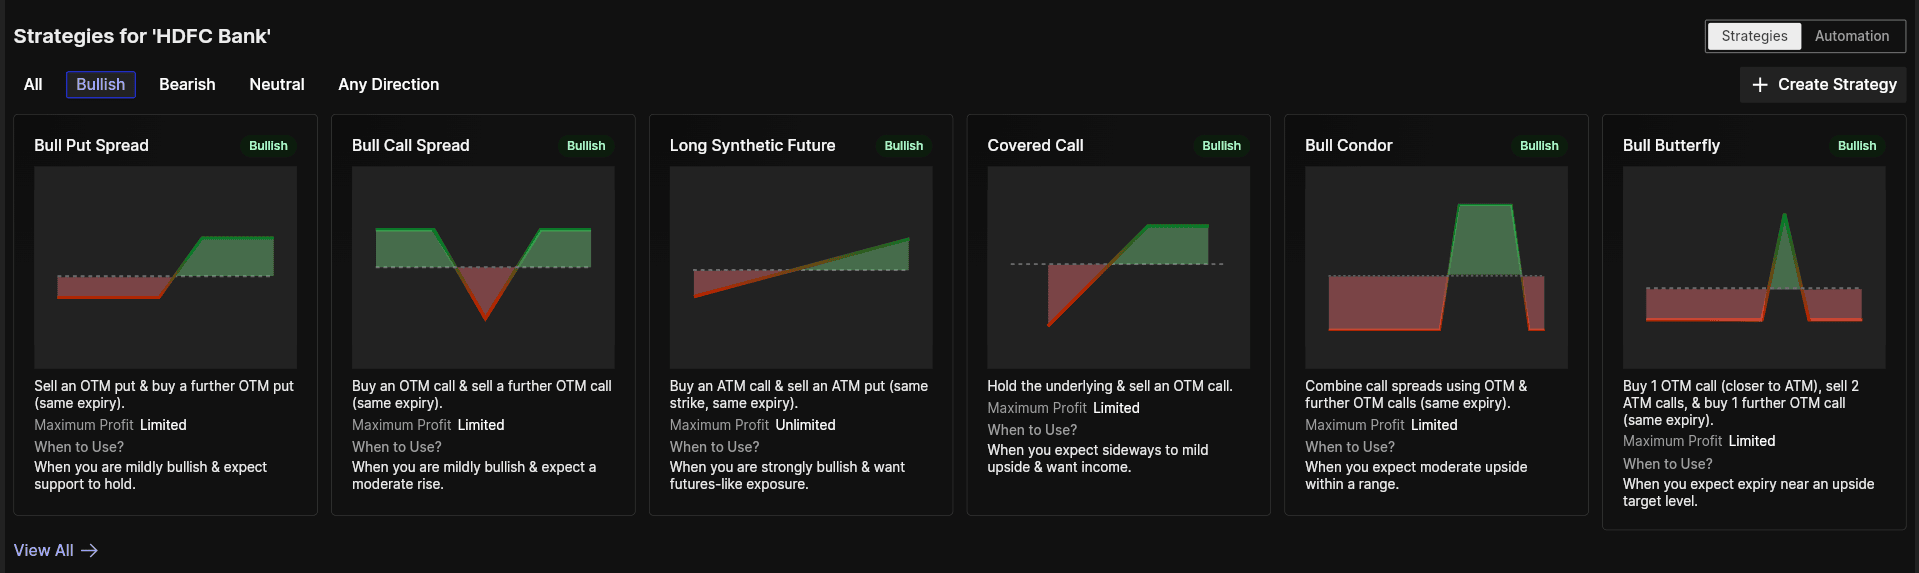
For stocks available in the F&O segment, the Strategies section lets you explore options strategies based on different market views.
You can browse strategies under Bullish, Bearish, Neutral, and Any Direction. Each card shows the strategy structure and payoff graph, giving you a quick view of how it works.
From here, you can explore more strategies, create one using Strategy Builder, or continue to Automate.
Continue Your Analysis with Tools
The Tools section connects the selected stock to other relevant FYERS features.
Depending on the stock, you can start an Equity SIP, open the Stock Dashboard, study its Option Chain, or continue to the F&O Dashboard.

Continue Your Company Research
When you want to go beyond Snapshot, continue to Fundamentals, Shareholdings, and Corporate Details for a more detailed view of the company.
Explore Long-Term Financial Performance with Fundamentals
While Snapshot gives you a quick introduction, Fundamentals lets you explore the company’s financial history across more than 20 years.
You can review how the business has evolved across different market and economic cycles and follow long-term changes in revenue, profitability, margins, assets, liabilities, and cash flow.
Track Ownership Changes with Shareholdings
The Shareholdings section shows how ownership in the company is distributed and how it has changed over time.
You can review promoter, institutional, and public shareholding across reporting periods and identify changes in the company’s ownership structure.
Review Company Updates with Corporate Details
Corporate Details brings together company-related information and updates that may be relevant while studying the stock.
You can review the available corporate information for the selected company and move into the specific area that requires attention.
Continue with Technical Analysis
When the Overview is not enough, the dedicated technical sections let you study the stock in greater detail.
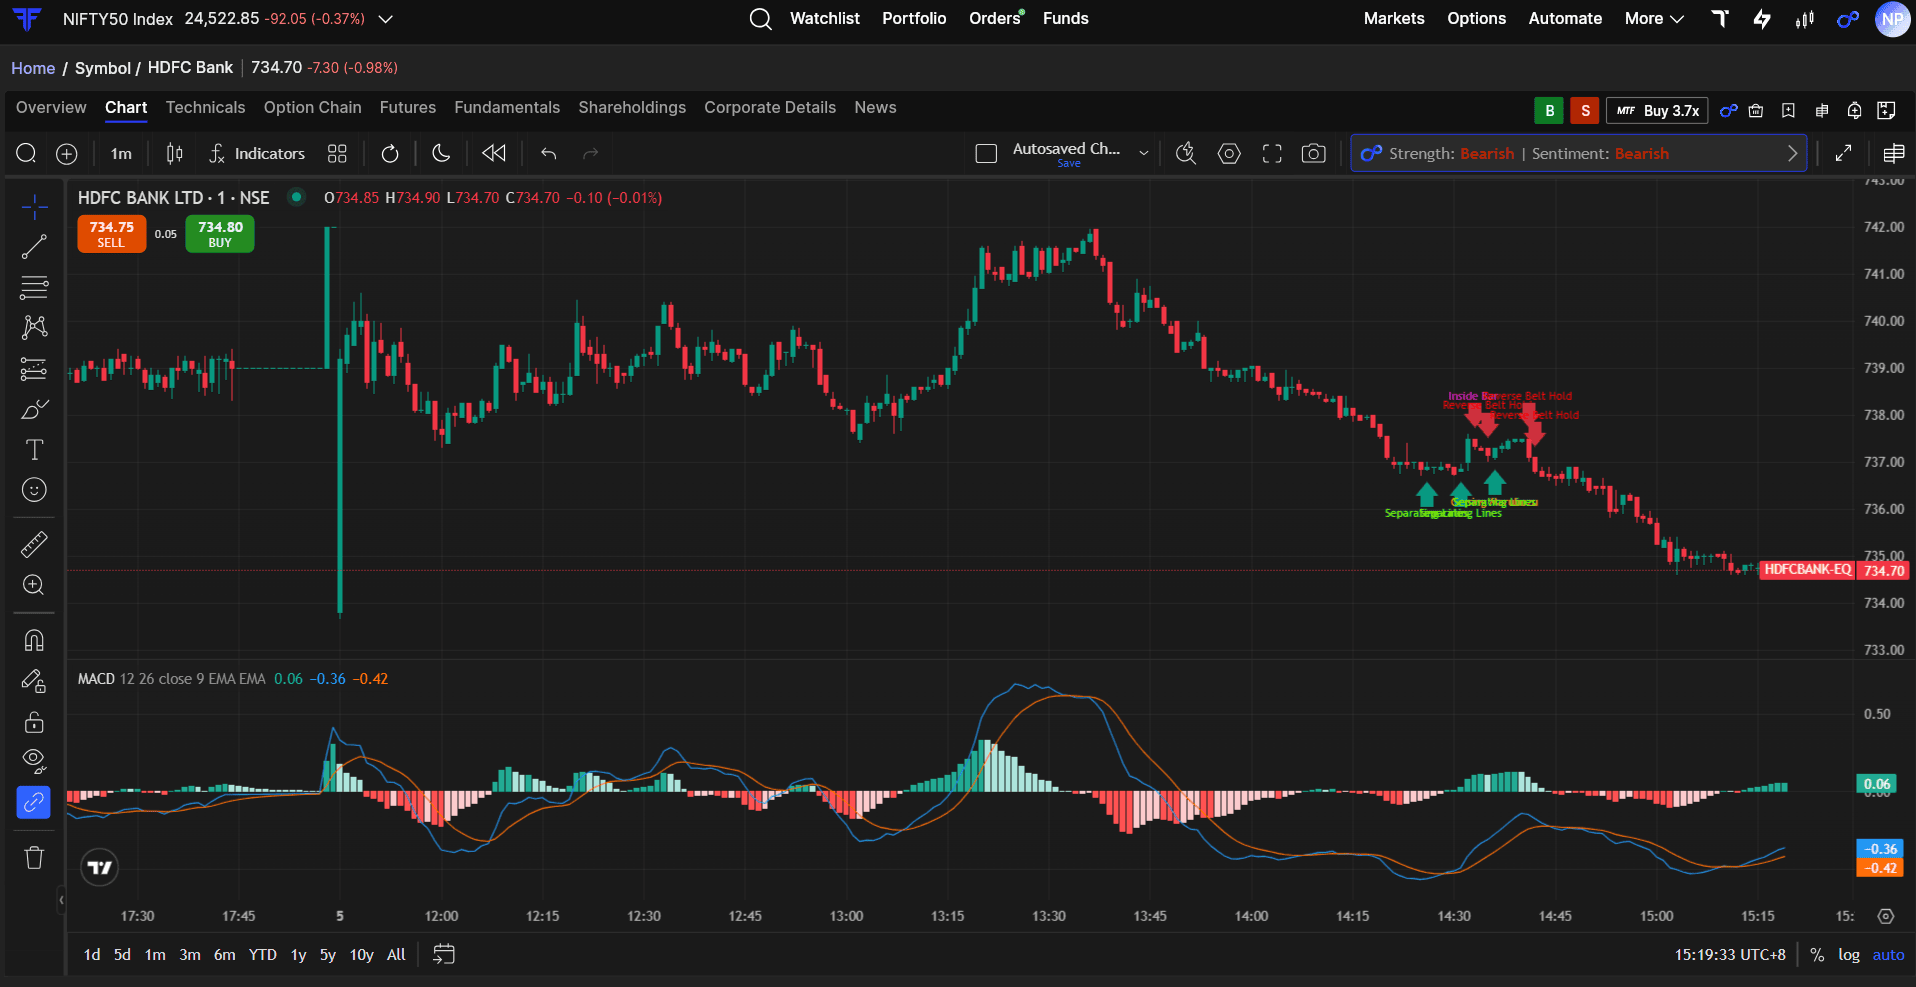
Analyse Price Trends with Charts
The Charts section provides the complete charting experience for the selected stock.
You can study price movements across different timeframes, apply indicators, use drawing tools, and examine the setup in greater detail.
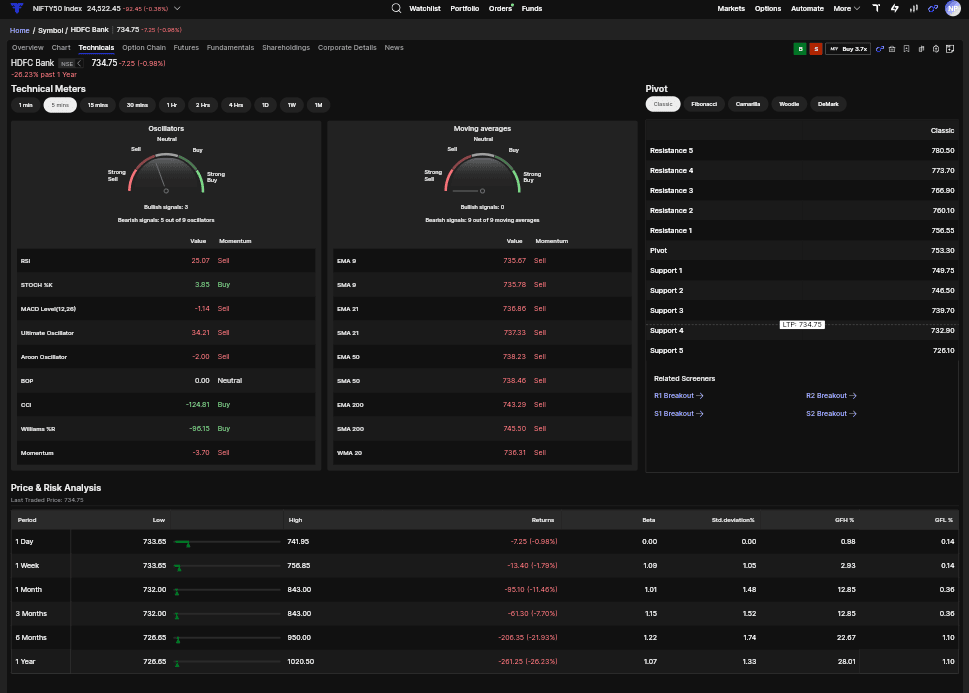
Study Technical Signals with Technicals
The Technicals section brings together technical information for the selected stock.
It provides another way to examine trends, momentum, and important technical levels before returning to Charts for a closer view.
Explore Related F&O Contracts
For stocks available in the F&O segment, Symbol Details also connects the equity with its futures and options market.
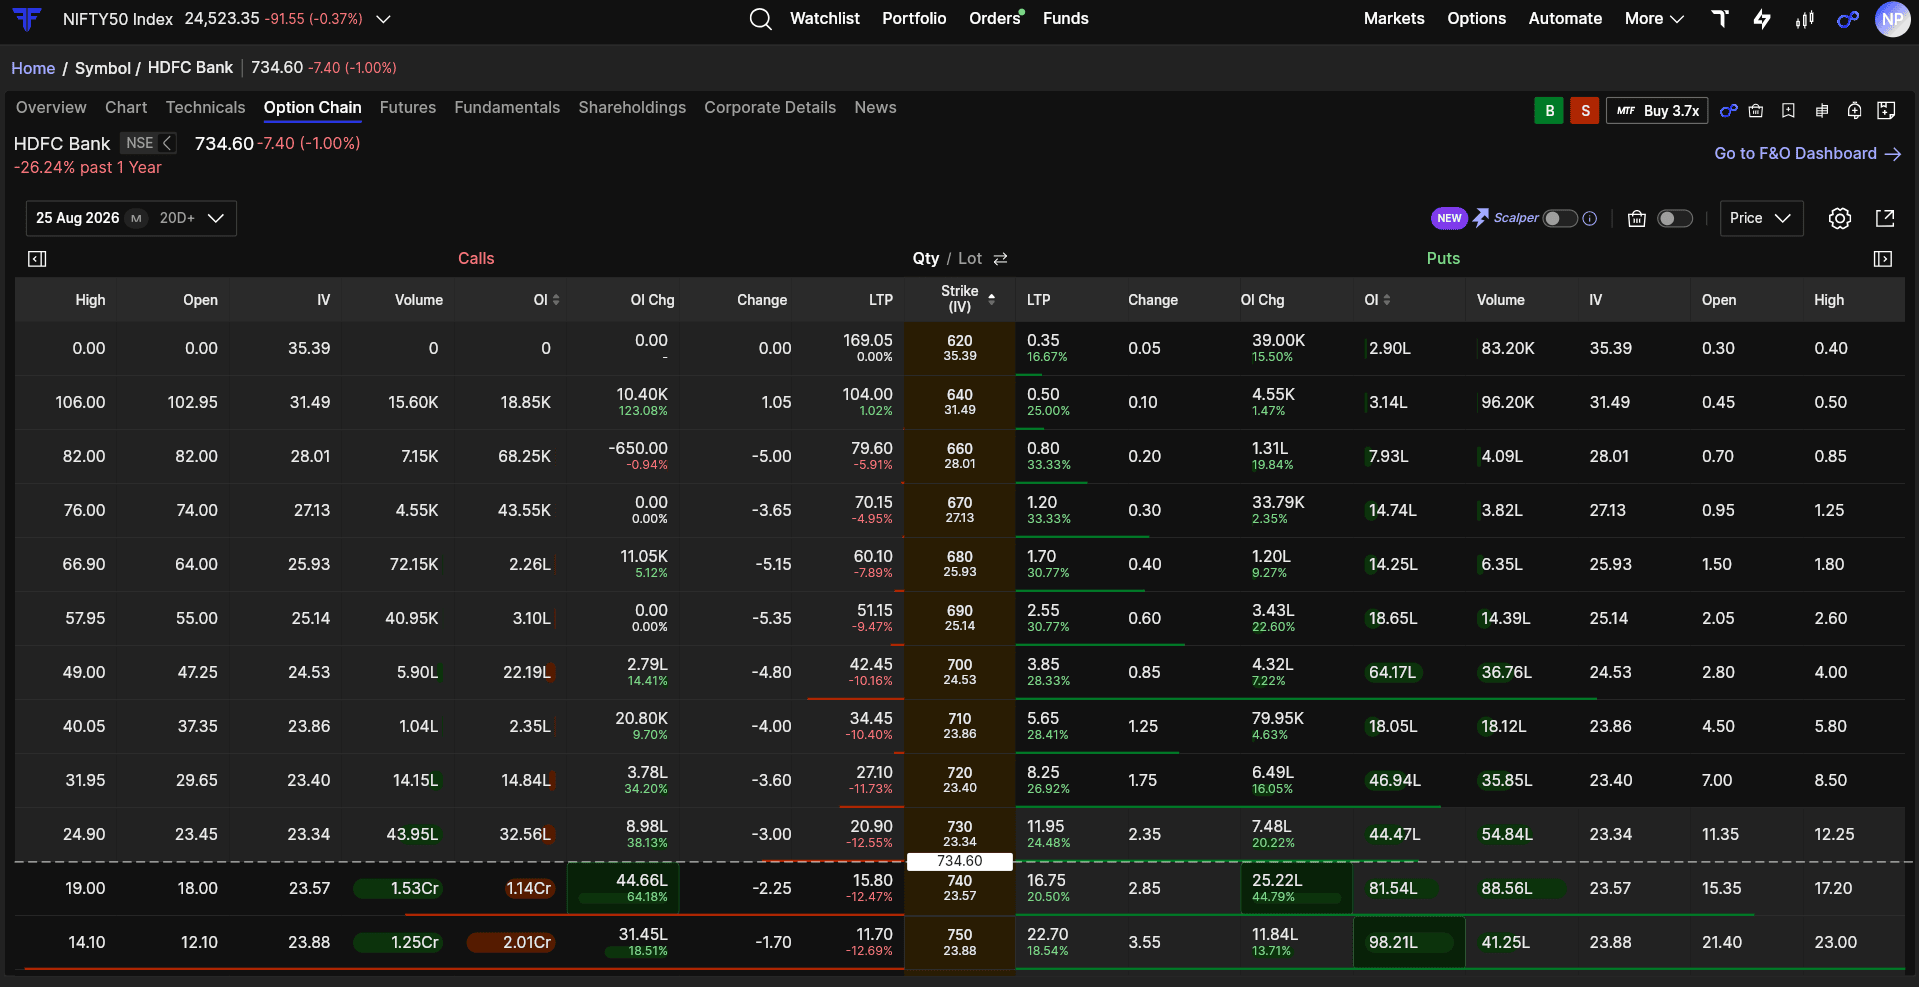
Analyse Options Contracts with Option Chain
The Option Chain lets you study Call and Put contracts across different strikes and expiries.
You can move from the cash-market stock to its options data, compare available contracts, and examine market activity around the underlying.
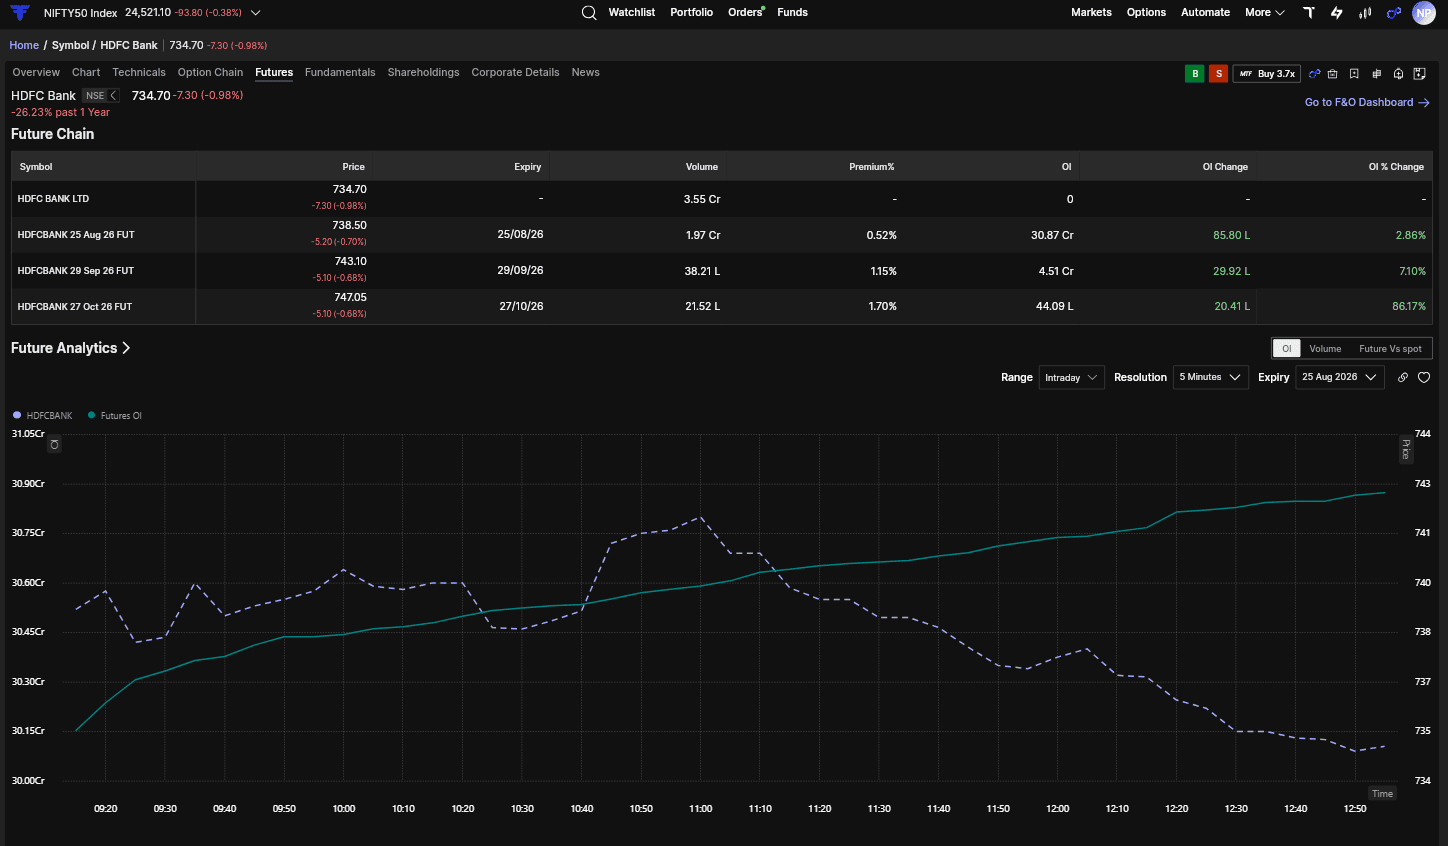
Compare Available Futures Contracts with Futures
The Futures section shows the available futures contracts for the selected stock.
You can compare contracts across expiries and review their price, volume, Open Interest, and premium or discount to the underlying before opening the contract you want to study.
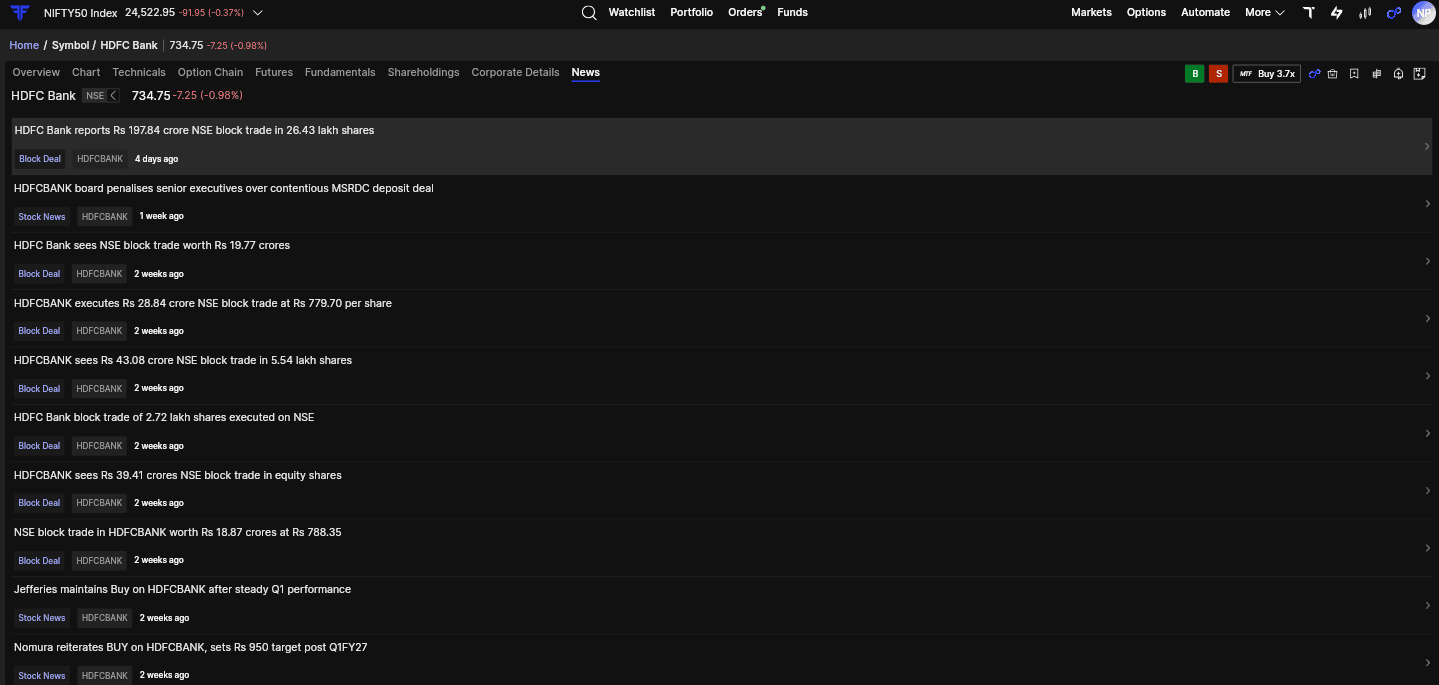
Follow Company Developments with News
Understanding a company does not end with its financials or charts. Business announcements and market developments can add important information to your research.
The News section brings together recent updates related to the selected company, helping you follow developments as they unfold.
Have questions about Symbol details? Check out the FAQ section.
Bring Every Layer of Stock Research Together
A stock may first catch your attention because of its price, but understanding it often requires much more.
With Symbol Details on FYERS, you can begin with the Overview, continue into detailed Charts and Technicals, explore more than 20 years of Fundamentals, track ownership through Shareholdings, review Corporate Details, analyse related F&O contracts, and follow the latest News.
Search for a stock on FYERS Web or App and open Symbol Details to begin.