


Market research often starts with a simple question: what’s happening in the market today?
You may want to check how NIFTY and BANKNIFTY are moving, see whether Gold or Crude Oil is active, look at global markets, track sector performance, or find out where activity is building up in Futures and Options.
Usually, this means switching between multiple pages, platforms, and sources.
Market Overview on FYERS brings these key market updates together in one place, so you can quickly get a broader view before you start analysing further.
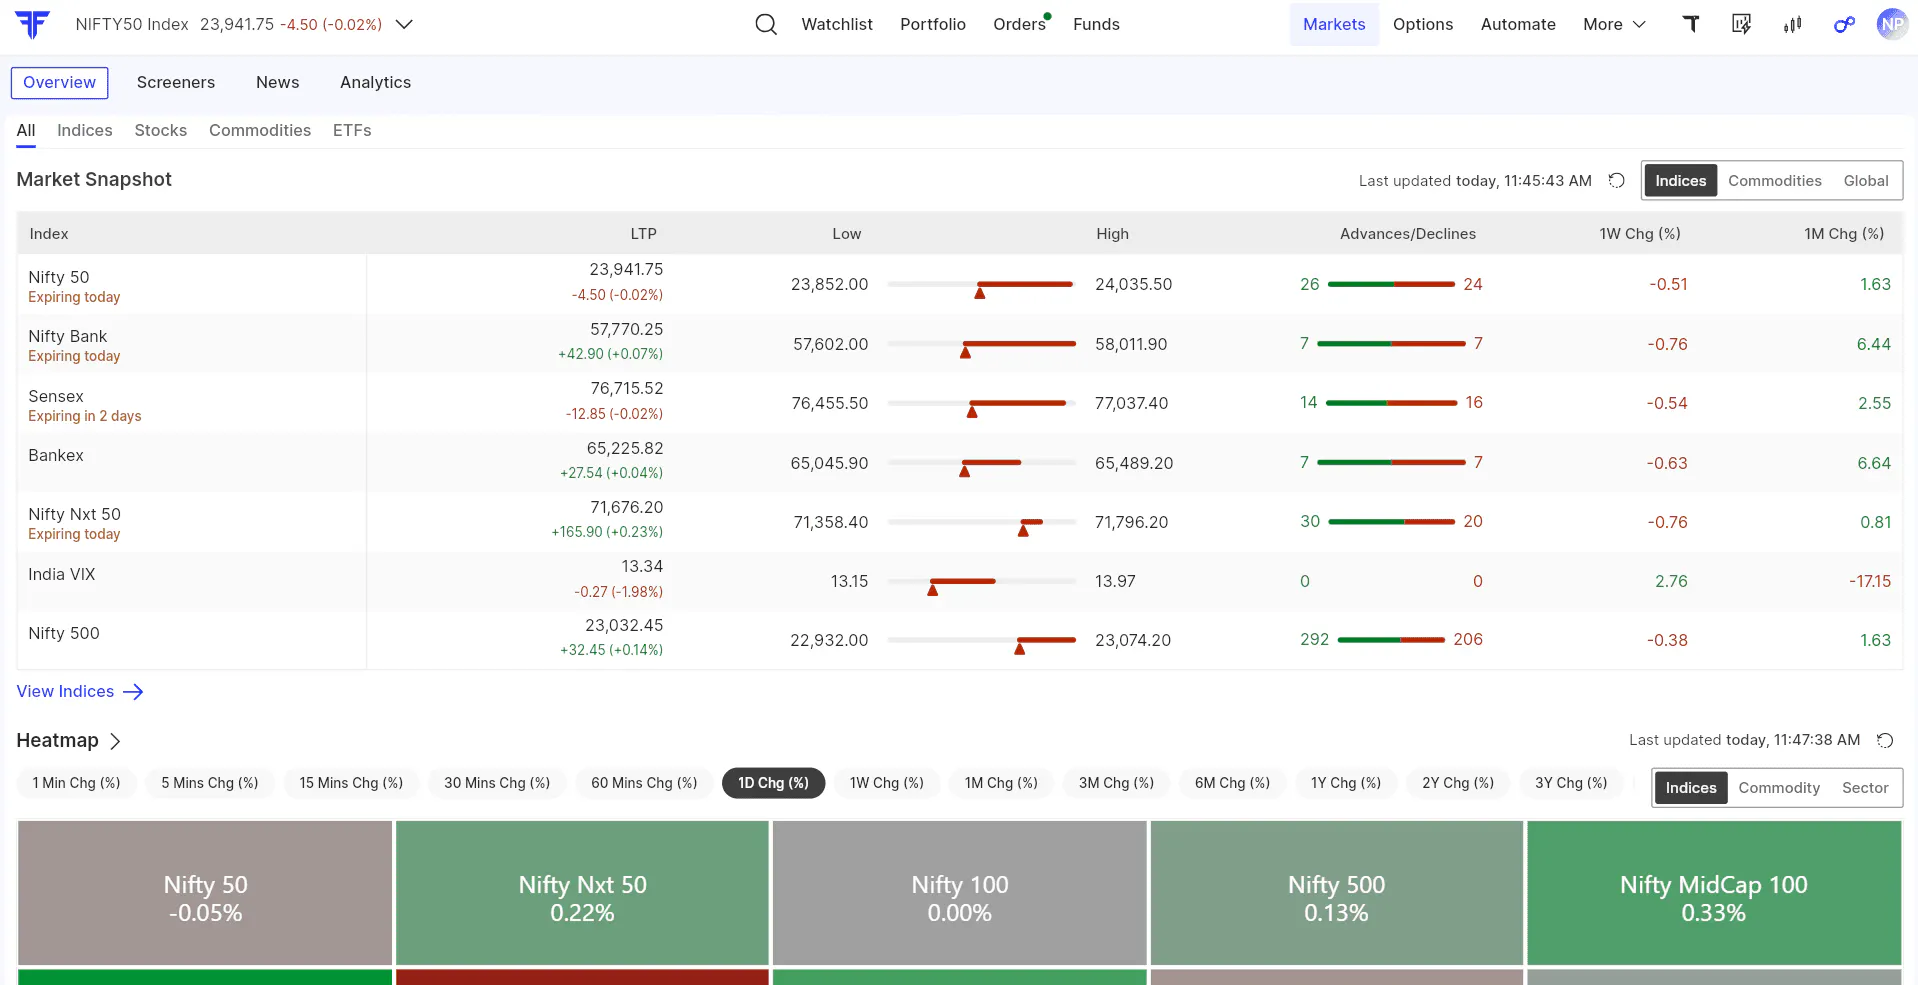
The Market Snapshot section helps you track key indices such as Nifty 50, Nifty Bank, Sensex, India VIX, and more.
You can view important details like LTP, day’s low and high, advances and declines, and percentage change across different timeframes. This gives you a quick sense of how the broader market is performing.
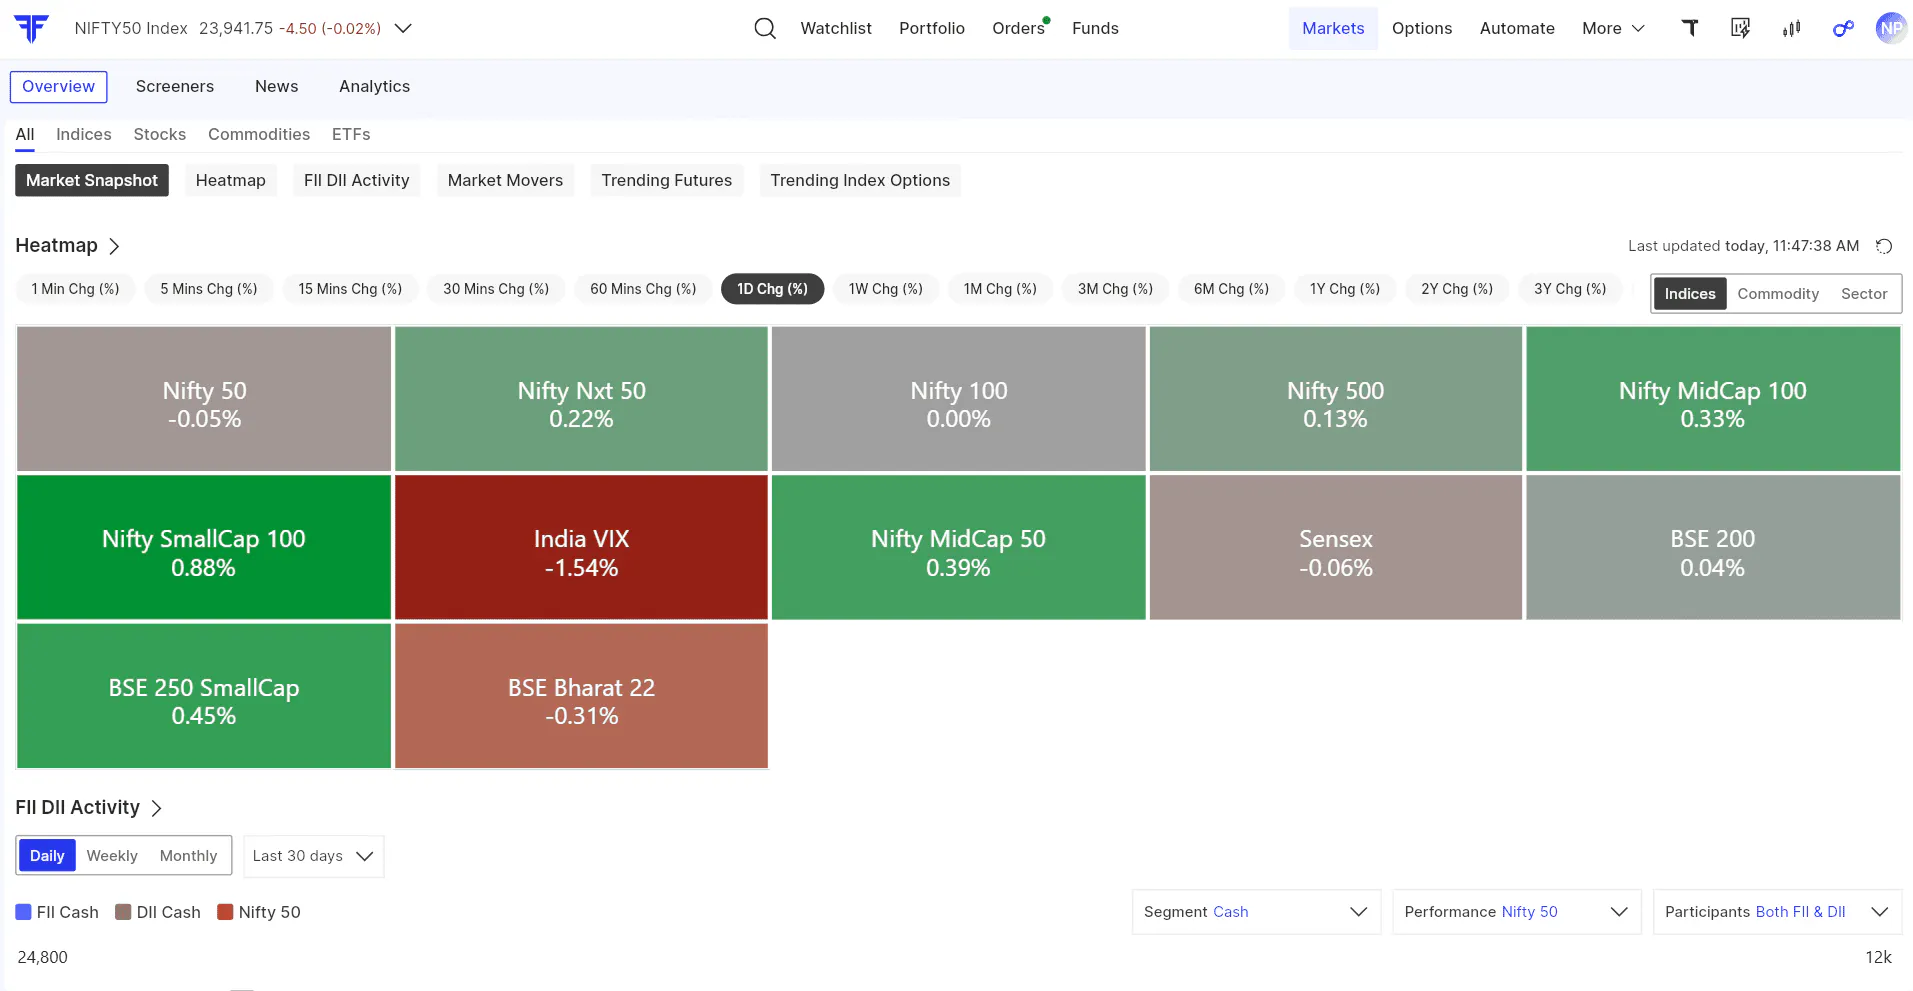
Heatmaps make it easier to understand market movement visually.
You can quickly see which indices, commodities, or sectors are gaining or falling based on the selected timeframe. Instead of going through multiple rows of data, the heatmap helps you spot market strength or weakness at a glance.
Read our blog on FYERS Heatmaps to visualise market trends better.
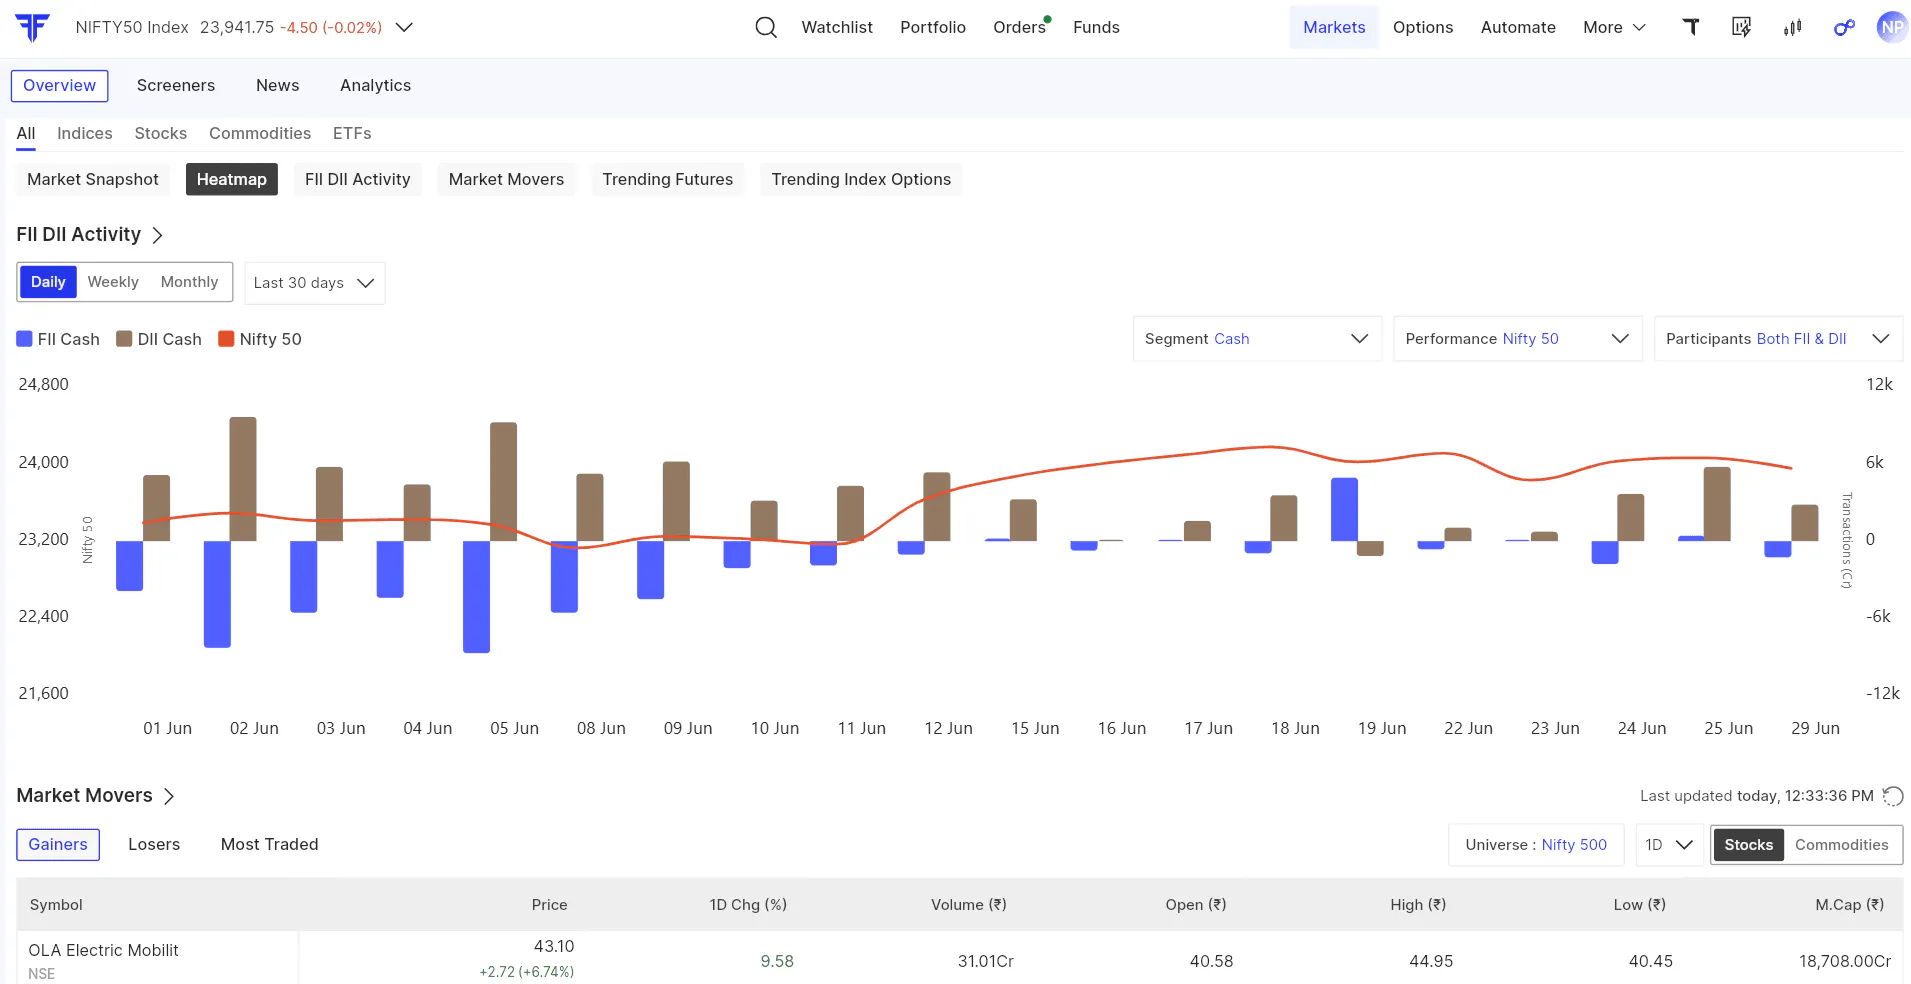
Market Overview also includes FII and DII activity, helping you see how institutional participation has moved over a selected period.
You can compare FII cash, DII cash, and Nifty 50 performance in one chart to understand how institutional flows are moving with the market.
Read our blog on FII & DII Activity to understand institutional flows.
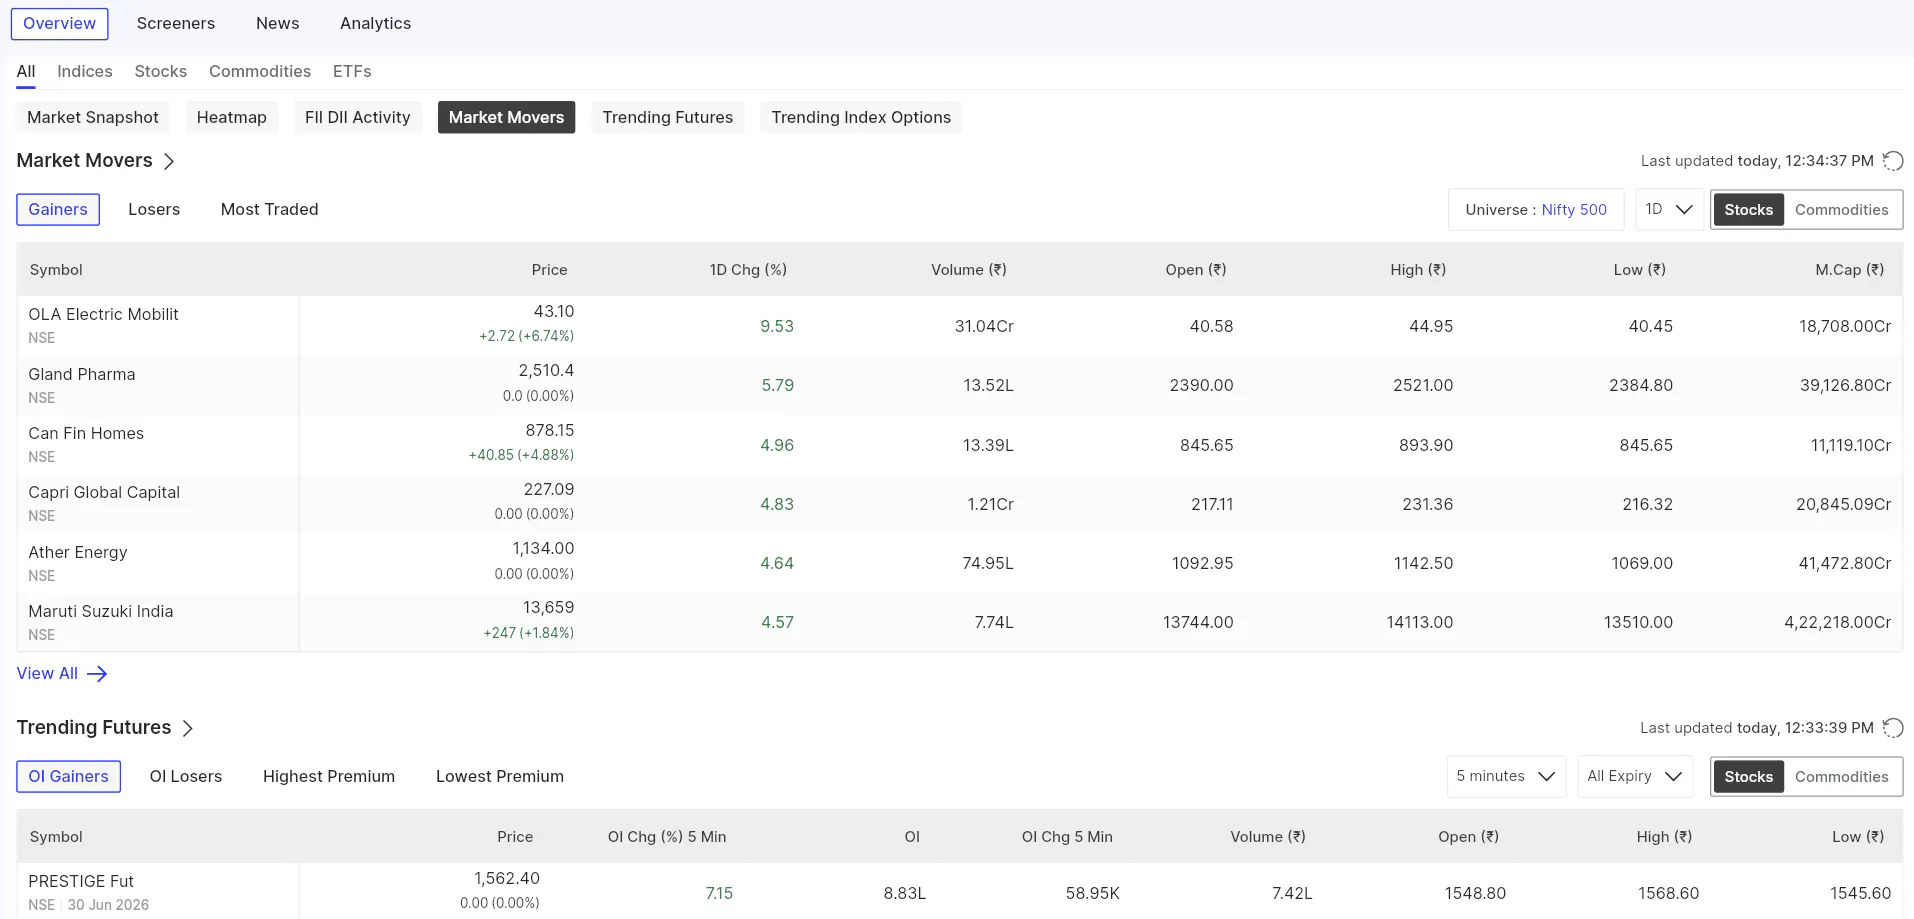
The Market Movers section helps you identify stocks or commodities that are gaining, losing, or seeing higher trading activity.
You can check details like price, 1D change, volume, open, high, low, and market cap to quickly understand which instruments are active during the day.
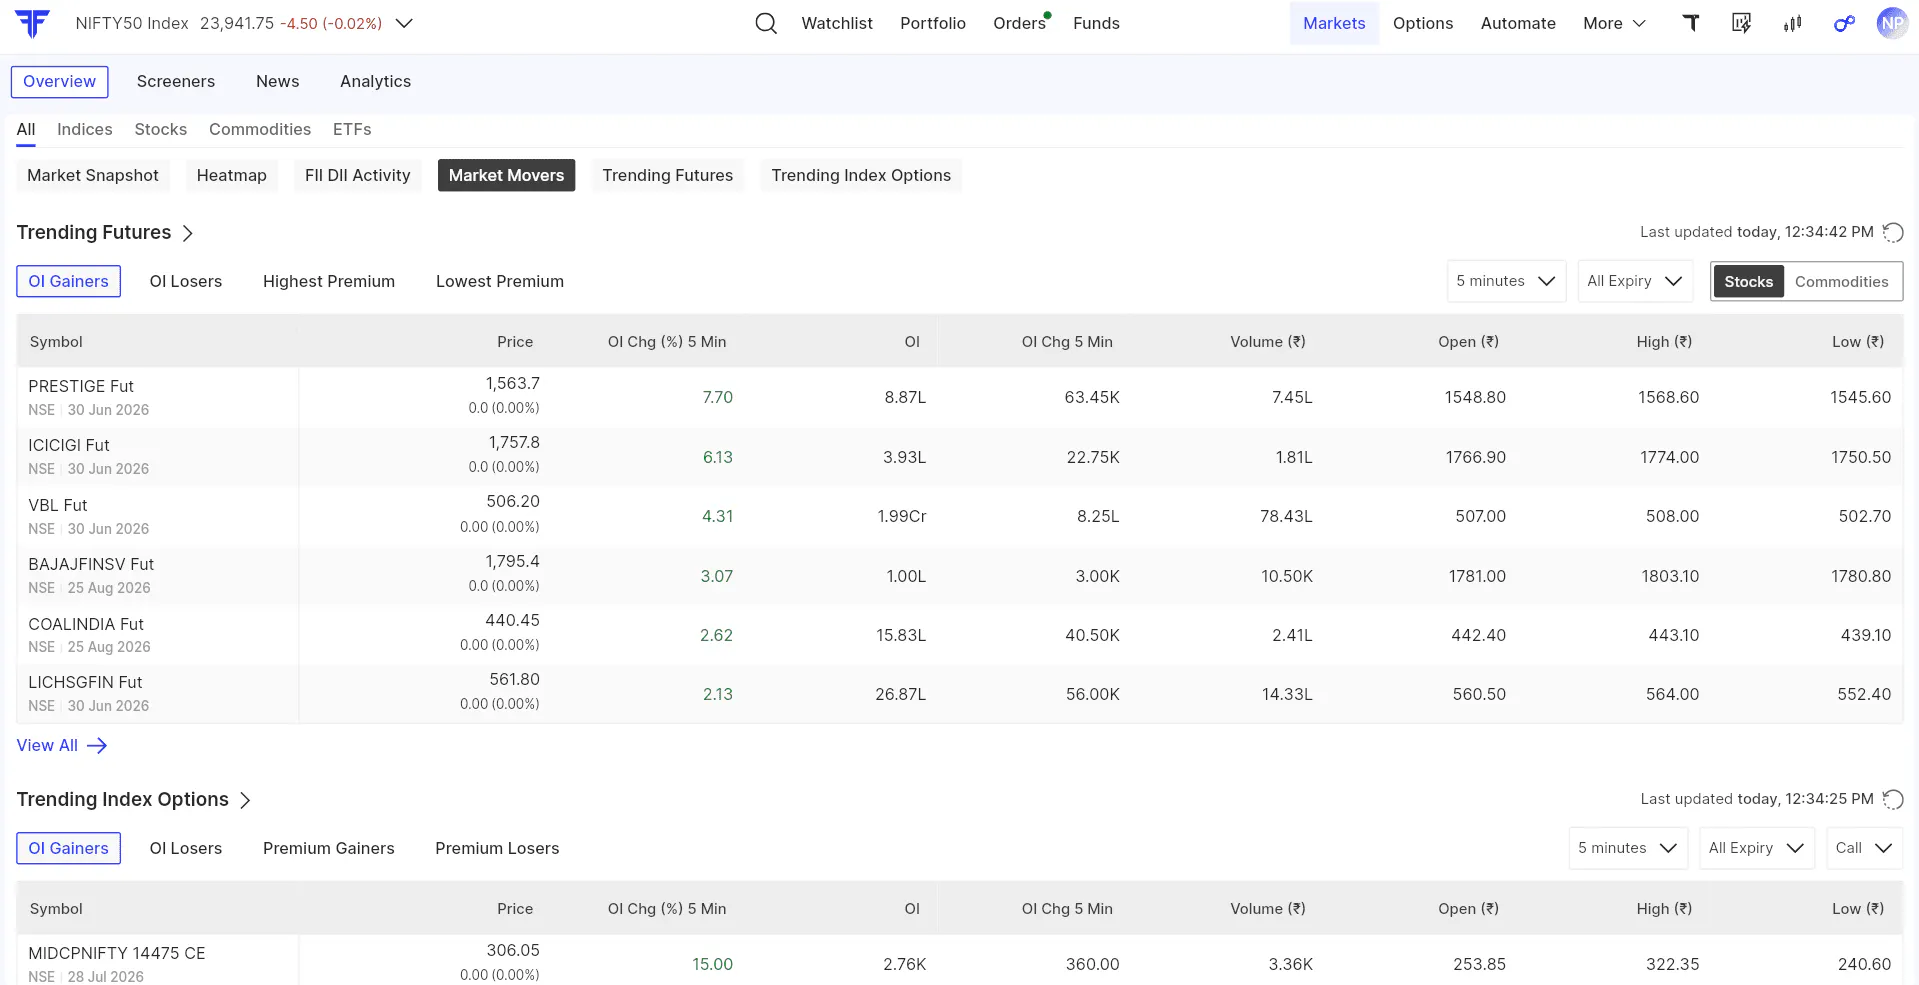
For derivatives tracking, Market Overview includes Trending Futures and Trending Index Options.
You can view OI gainers, OI losers, premium gainers, premium losers, and other activity-based lists. This helps you quickly identify where Open Interest, volume, and price movement are building up.
Log in to FYERS Web or App.
Go to Markets.
Open the Overview tab.
Use the available sections to track market activity across indices, stocks, commodities, ETFs, Futures, and Options.
Have questions about Market Overview? Check out the FAQ section.
Market Overview is designed to make market tracking easier.
Whether you want to check indices, heatmaps, institutional activity, market movers, futures, or index options, you can access these updates from a single dashboard on FYERS.
It helps you spend less time switching between sections and more time understanding what is moving in the market.
Explore Market Overview on FYERS and let us know your feedback in the comments.
