


Some patterns repeat every year.
A jewellery business may see higher demand during wedding and festive seasons. An air-conditioner company may see more interest before summer. Travel, agriculture, metals, energy, and many other businesses also go through phases where demand rises or slows down.
Markets can show similar behaviour too.
Certain stocks, sectors, indices, ETFs, and commodities have performed better during specific parts of the year. This does not mean the same pattern will repeat every time. But looking at these patterns can give you useful context before making a trading or investing decision.
That is why we built Seasonality Insights on FYERS.
It helps you study past market behaviour in a simple visual way, without manually going through years of data.
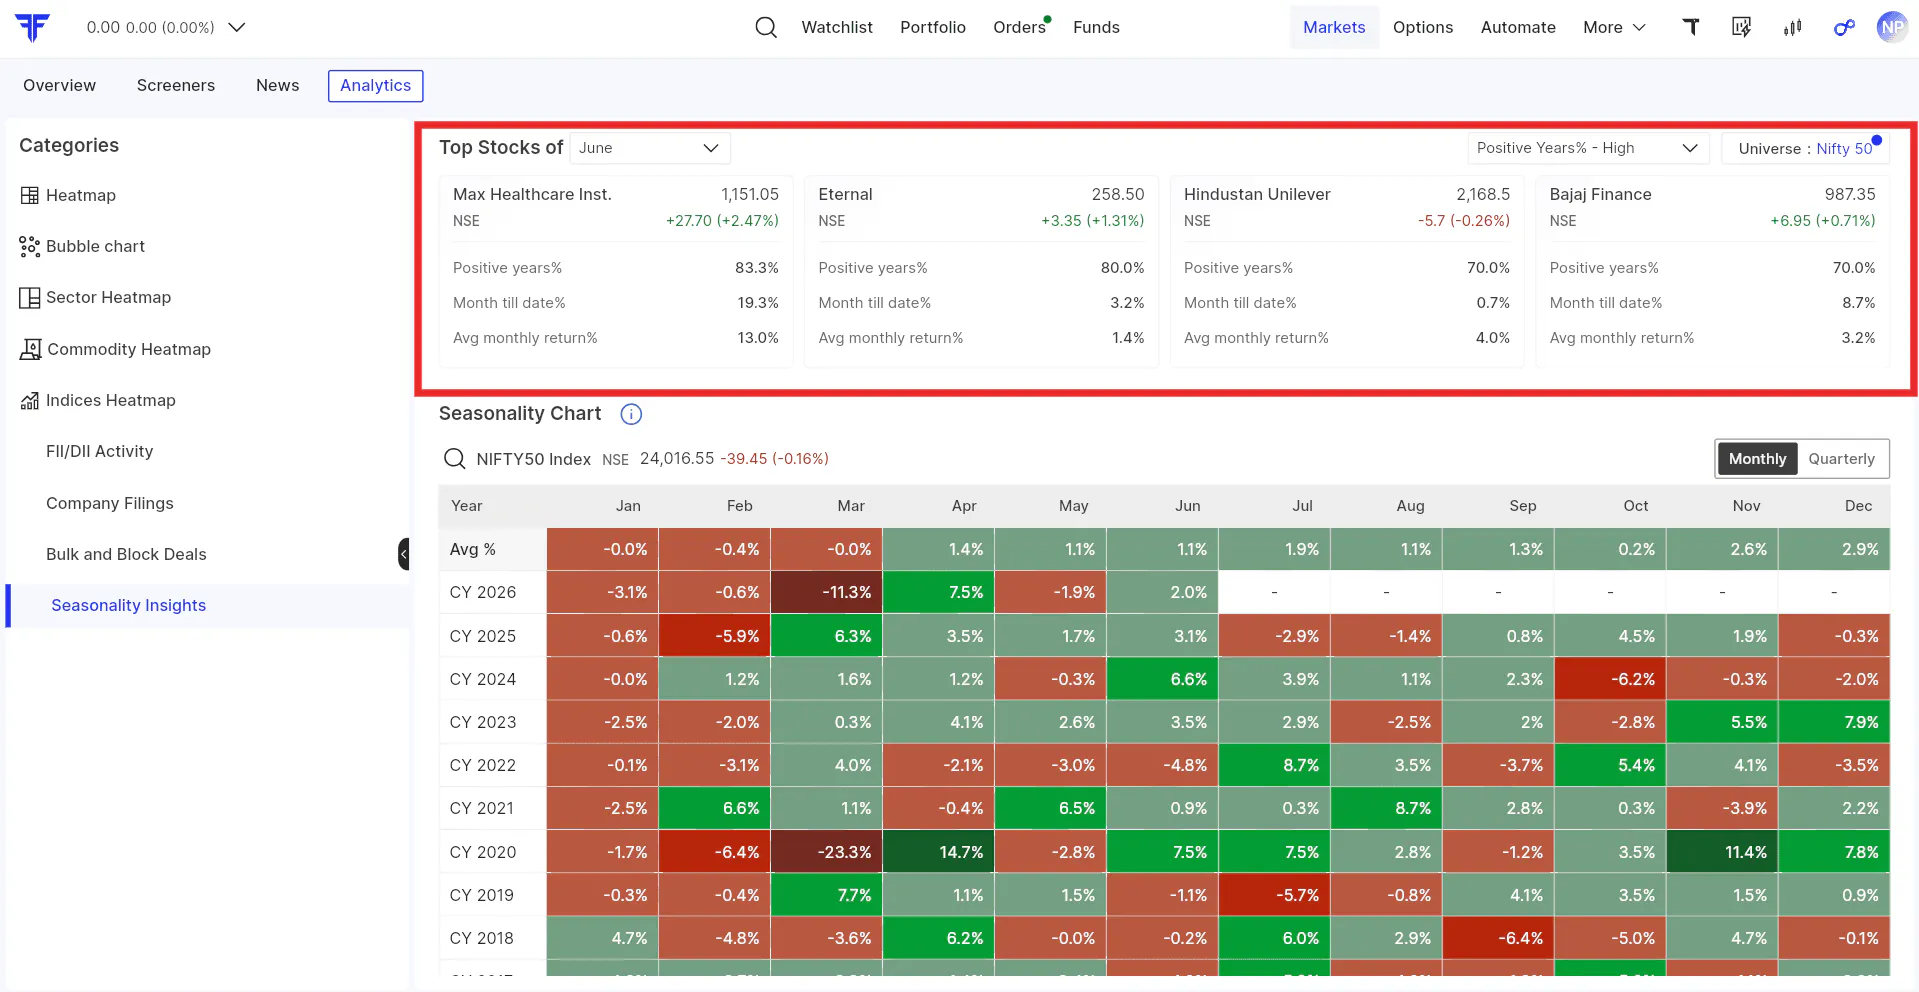
Let’s say you want to know which stocks have usually done well in June.
With Seasonality Insights, you can select June and instantly see stocks that have shown strong performance during this period in the past.
You can also sort the list based on consistency and filter it by universe, such as F&O stocks or Nifty 500 stocks.
For every stock, you get a few simple data points:
Positive Years % shows how often the stock ended positive during that period.
Month Till Date % shows how the stock has performed so far in the current month.
Average Return % shows the average return the stock has delivered during that period over the years.
This helps you quickly spot names that may be worth studying further.
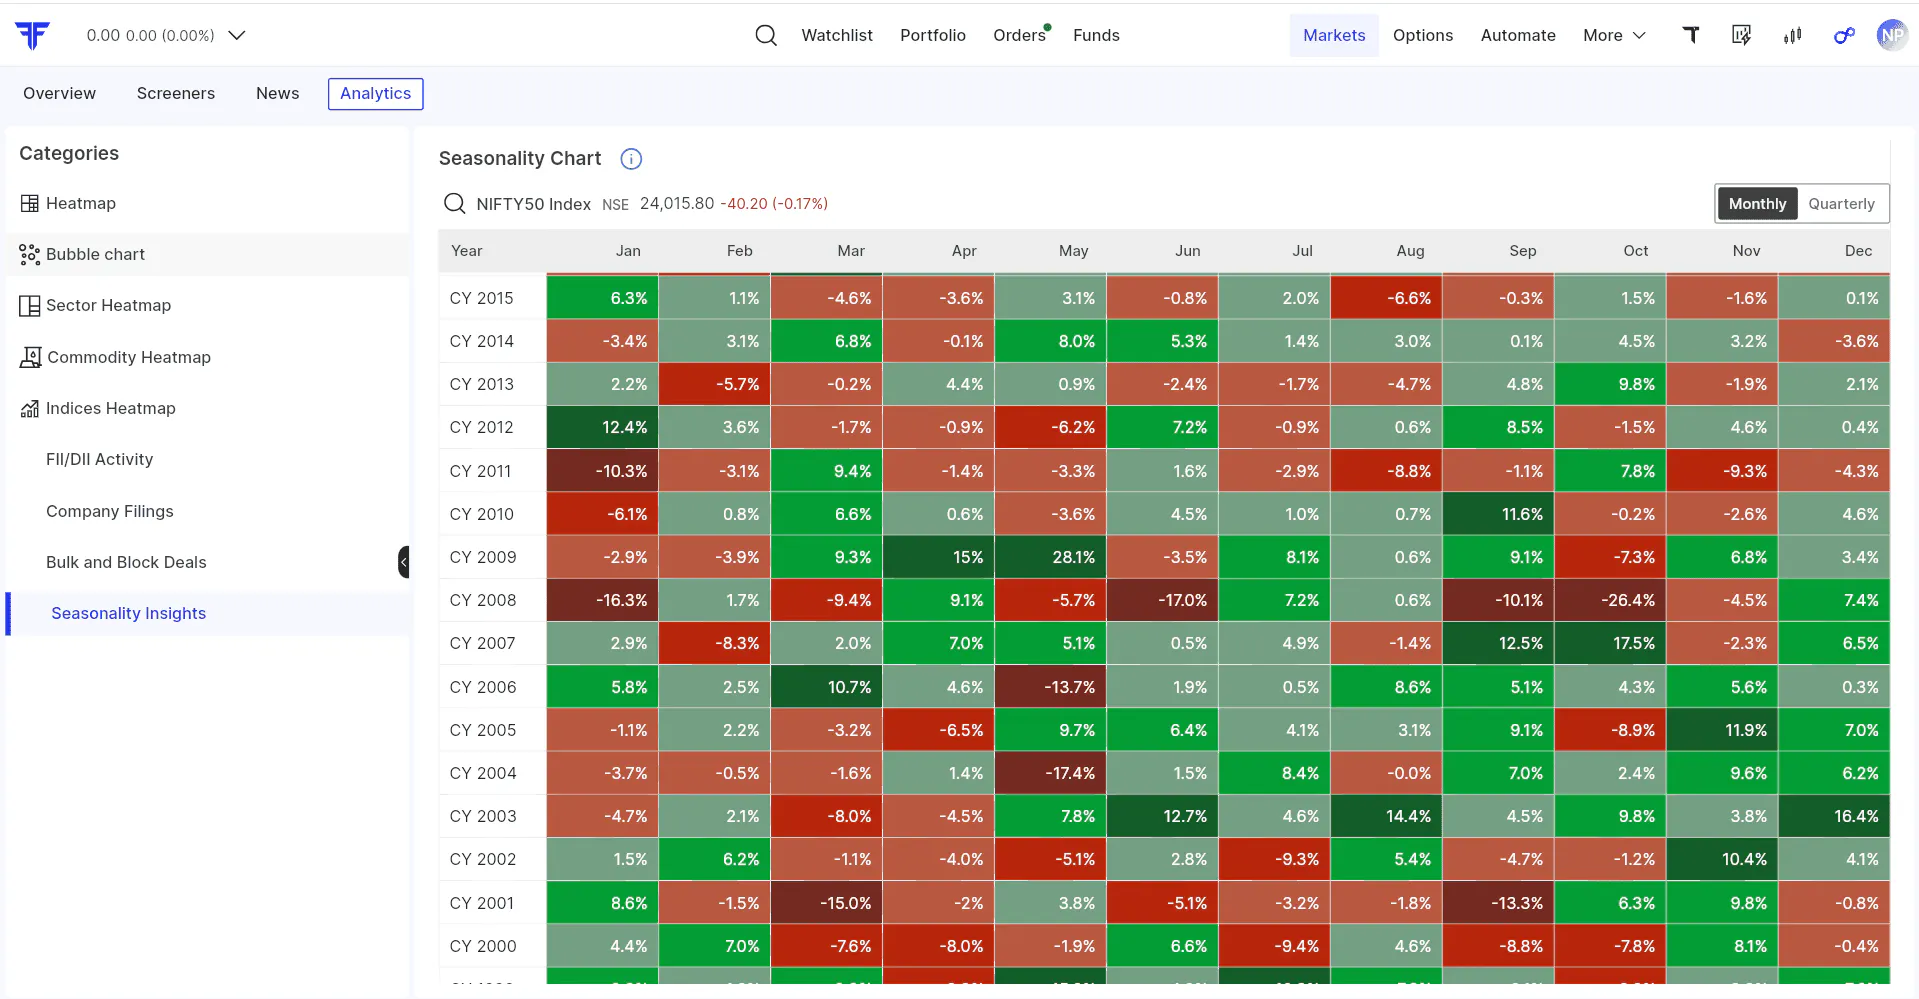
Once something catches your attention, you can study it in more detail using the heatmap.
Depending on the listing date, you can view up to 30 years of historical data.
The heatmap makes it easy to see how the asset has behaved across different parts of the year. Green and red shades help you quickly understand where it has performed well, where it has struggled, and where the performance has been mixed.
You can also check the average return and the number of positive and negative years. This helps you understand not just the return, but also how consistent the pattern has been.
Seasonality Insights is not just a static data view.
Once you find something interesting, you can take the next step from the same place. You can open the chart, track the stock, or place an order when it fits your view.
This keeps the flow simple: discover a pattern, study it deeper, and act only when it supports your own analysis.
Seasonality is not a prediction.
A stock doing well in June for many years does not guarantee that it will do well this June too. Markets are affected by earnings, news, global cues, liquidity, sentiment, and many other factors.
But seasonality helps you ask better questions.
Has this stock usually done well during this period?
Is the current move similar to what we have seen in the past?
Is this year behaving differently from earlier years?
When used along with your own research, charts, fundamentals, and risk management, Seasonality Insights can give you one more useful layer of market context.
Log in to FYERS Web or App.
Go to Markets.
Click Analytics.
Select Seasonality Insights.
Explore Seasonality Insights on FYERS and see how markets have behaved across different parts of the year.
We would love to hear your feedback.
