30 Jul, 2025
 4 mins read
Volatility is a term often heard in financial discussions, especially when markets move unpredictably. It is a key concept for investors and traders to understand, as it directly impacts investment risk and returns. This blog explains what volatility means in the stock market, the different types, how it is measured, what causes it, and how to manage it effectively.
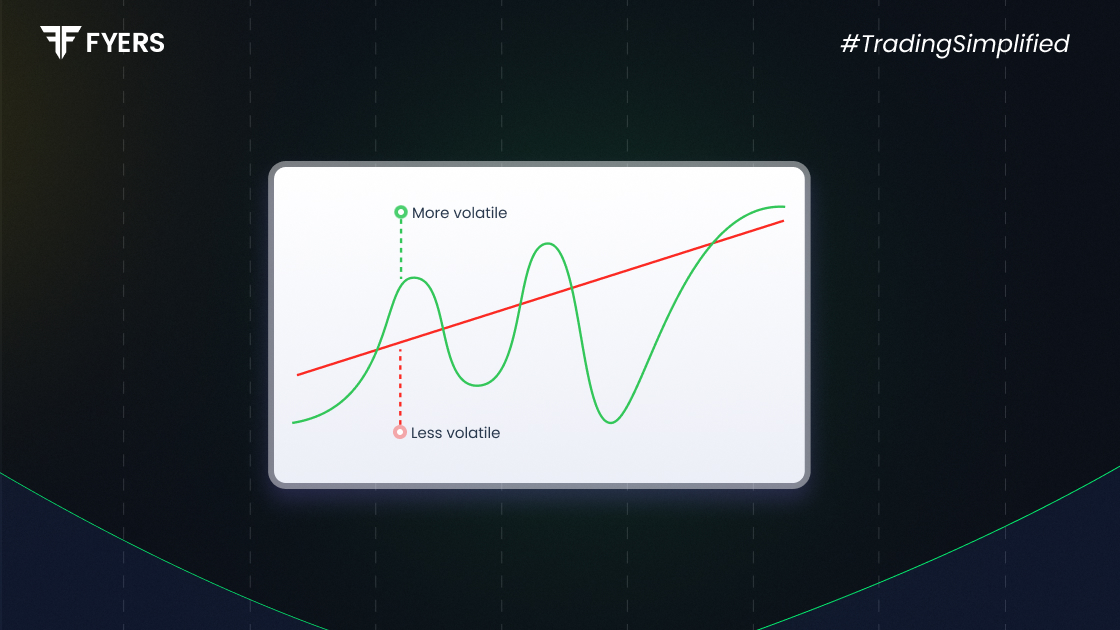
In the stock market, volatility refers to the degree of variation in the price of a financial instrument over time. Simply put, it measures how much the price of a stock or index fluctuates. High volatility means large price swings, while low volatility indicates steadier price movements.
Volatility is not inherently good or bad. It reflects the level of uncertainty or risk in the market. During volatile periods, prices can rise or fall sharply in a short time, often driven by economic events, political changes, or investor sentiment.
Volatility in the stock market can be categorised into several types:
Historical Volatility: Measures how much a stock's price has fluctuated over a specific period in the past.
Implied Volatility: Derived from option prices, it reflects the market's expectation of future volatility.
Intraday Volatility: Refers to price changes that happen within a single trading session.
Market Volatility: Describes the overall market's price fluctuations, not just a single stock.
Understanding each type helps investors make informed decisions based on time horizons and risk preferences.
Volatility is typically calculated using standard deviation, which measures how spread out returns are from the average return. Here’s a simplified step-by-step method:
Calculate the daily returns of the stock.
Compute the average return.
Find the difference between each daily return and the average.
Square those differences and take the average.
Take the square root of that average. This gives the standard deviation.
Standard deviation is usually annualised to compare across stocks and timeframes.
Example:
If Stock A has returns of 2%, -1%, 3%, and -2% over 4 days, the standard deviation gives an idea of how widely these returns vary from the mean.
There are several statistical tools and indices used to measure volatility:
Standard Deviation: Commonly used to measure the volatility of asset returns.
Beta: Indicates a stock's volatility in relation to the overall market. A beta above 1 means more volatile than the market.
Average True Range (ATR): Shows the average movement of a stock over a set period, capturing gaps and price swings.
India VIX: Known as the fear index, it measures expected volatility in the Nifty 50 over the next 30 days based on option pricing.
Each of these tools serves different purposes and can be chosen based on the analysis objective.
Market volatility is influenced by various internal and external factors. Some common causes include:
Economic Data: Reports on inflation, GDP, employment, etc., can trigger market reactions.
Political Events: Elections, policy changes, or geopolitical tensions often cause price movements.
Global Markets: International developments can spill over into domestic markets.
Corporate Earnings: Better or worse-than-expected results can move stock prices.
Investor Sentiment: Emotions like fear or greed can drive irrational price swings.
Liquidity: Low trading volumes can lead to higher price swings, especially in smaller stocks.
Understanding these factors helps investors anticipate and respond better to volatility.
While volatility is unavoidable, investors can take steps to manage its impact:
Diversification: Spread investments across sectors and asset classes to reduce risk.
Long-Term Focus: Short-term volatility may not matter if you have a long-term perspective.
Asset Allocation: Maintain a balanced mix of equities, debt, and other instruments.
Avoid Panic: Emotional reactions to market swings often lead to poor decisions.
Review and Rebalance: Regularly check your portfolio and adjust it based on goals and risk appetite.
Use Stop-Loss Orders: Helps limit potential losses during unexpected price drops.
Volatility can create opportunities too. Savvy investors often use it to buy undervalued stocks or rebalance their holdings at better prices.
Volatility is a natural part of financial markets and an important indicator of risk. Understanding its types, how it is measured, and what causes it can help investors make more informed decisions. While it may seem intimidating, proper planning, discipline, and a long-term view can help manage its impact. Rather than fearing volatility, learning how to navigate it is key to becoming a successful investor.
Volatility refers to how much and how quickly the price of a stock or market moves up or down.
It depends. High volatility can offer more opportunities for traders but may pose risks for long-term investors.
India VIX is a volatility index that shows the expected volatility in the Nifty 50 index over the next 30 days.
Volatility is measured using tools like standard deviation, beta, ATR, and indices like India VIX.
Calculate your Net P&L after deducting all the charges like Tax, Brokerage, etc.
Find your required margin.
Calculate the average price you paid for a stock and determine your total cost.
Estimate your investment growth. Calculate potential returns on one-time investments.
Forecast your investment returns. Understand potential growth with regular contributions.

You have successfully submitted your partnership request form. You will be hearing us soon!