10 Sep, 2025
 4 mins read
Investors often look beyond absolute returns to judge how well an investment is performing. A fund may show high returns, but are those gains worth the level of risk taken? This is where risk-adjusted performance metrics come in. One such tool is the Treynor Ratio, which focuses on systematic or market-related risk. Developed by economist Jack Treynor, it tells you how much extra return an investment delivers for each unit of market risk.
In this article, we explain the Treynor Ratio meaning, how it works, the Treynor Ratio formula, its interpretation, advantages, and limitations. We’ll also compare the Treynor Ratio vs Sharpe Ratio and walk through a practical Treynor Ratio example.
The Treynor Ratio is a measure of risk-adjusted return that uses beta as the risk component. Unlike the Sharpe Ratio, which considers total risk (measured by standard deviation), the Treynor Ratio focuses only on systematic risk - the kind tied to market movements that cannot be diversified away.
This makes it particularly useful for diversified portfolios where unsystematic or stock-specific risks have already been reduced. By relating returns to market risk, it shows whether a portfolio has been fairly rewarded for the level of risk it carries.
The ratio compares the excess return of a portfolio (returns above the risk-free rate) with the portfolio’s beta.
Excess return: The additional return generated beyond a risk-free investment, such as government bonds.
Beta: A measure of how much a portfolio moves in relation to the overall market. A beta of 1 means the portfolio moves in line with the market, while a beta higher than 1 means greater sensitivity to market swings.
In short, the Treynor Ratio shows how efficiently a portfolio is generating returns relative to the market risk taken.
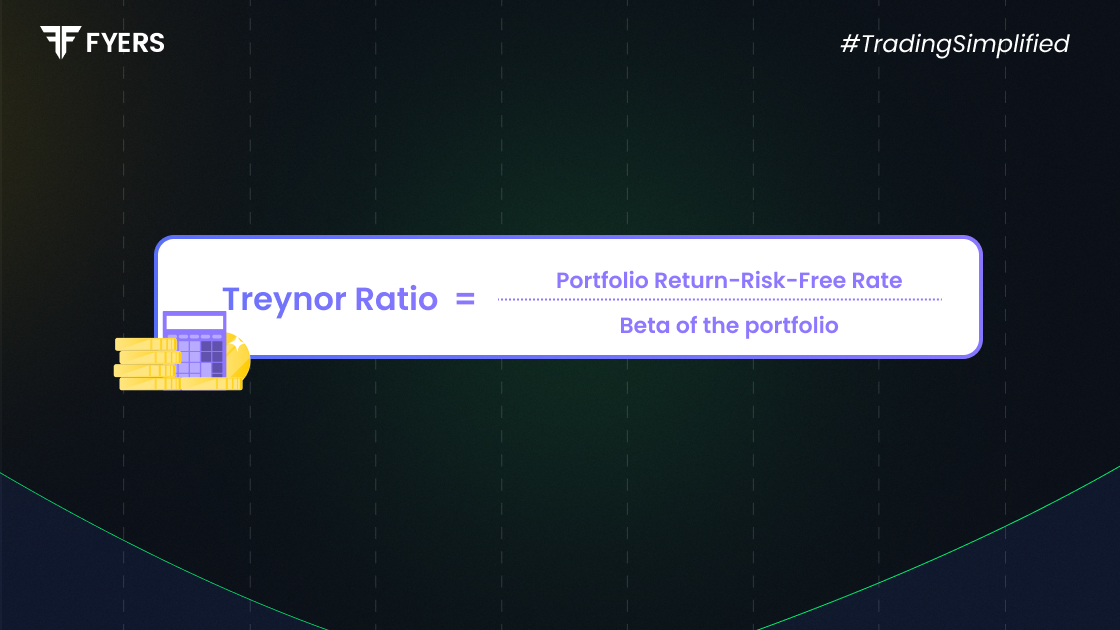
The calculation is straightforward:
| Treynor Ratio = (Portfolio Return − Risk-Free Rate) / Beta |
Where:
Portfolio Return = Annualised return, ideally net of fees and expenses
Risk-Free Rate = Yield on a safe security (e.g., 10-year Indian Government bond)
Beta = Portfolio’s sensitivity to a benchmark index such as Nifty 50 or Sensex
This formula helps investors see whether the portfolio has delivered adequate reward for the level of market risk.
Higher ratio - Better risk-adjusted performance
Zero or negative ratio - Poor performance or inadequate return for the risk taken
Comparisons - Best used when comparing diversified portfolios that are benchmarked to the same market index
It’s important to remember that the Treynor Ratio interpretation assumes the portfolio is well-diversified. If not, the result may be misleading since stock-specific risks are not considered.
|
Feature |
Treynor Ratio |
Sharpe Ratio |
|---|---|---|
|
Risk Measure |
Beta (systematic risk) |
Standard deviation (total risk) |
|
Best For |
Diversified portfolios |
All types of portfolios |
|
Use Case |
Evaluating performance relative to market risk |
Assessing overall portfolio volatility |
|
Focus |
Market risk-adjusted return |
Total risk-adjusted return |
Use the Treynor Ratio when the portfolio is diversified and you want to focus only on market risk.
Use the Sharpe Ratio when analysing portfolios that may still carry unsystematic risks.
Focuses on systematic risk, making it ideal for diversified portfolios
Aligned with the Capital Asset Pricing Model (CAPM)
Allows straightforward comparison between funds or ETFs
Highlights true performance by showing returns adjusted for market exposure
Assumes portfolios are diversified; unsuitable for concentrated holdings
Relies heavily on beta, which may not fully capture risk in volatile markets
Ignores unsystematic risk, which can be significant in smaller portfolios
Sensitive to input accuracy - errors in beta, returns, or risk-free rate can distort results
Consider this case:
Portfolio Return = 12% (annualised, net of fees)
Risk-Free Rate = 4% (10-year G-Sec yield)
Beta = 1.2 (relative to Nifty 50)
| Treynor Ratio = (12% − 4%) / 1.2 = 6.67 |
This means the portfolio earned 6.67% excess return per unit of market risk. The higher the number, the more efficiently the portfolio is using market risk to generate returns.
The Treynor Ratio is a valuable tool for assessing how well an investment rewards investors for the market risk taken. While it is particularly effective for diversified portfolios, it should not be used in isolation. Combining it with other measures like the Sharpe Ratio and Jensen’s Alpha gives a fuller picture of portfolio performance.
For investors and analysts, knowing how to calculate Treynor Ratio and how to interpret it provides an extra layer of insight into whether returns truly justify the risks involved.
It shows how much excess return a portfolio has earned for each unit of market risk. A higher ratio means more efficient risk-adjusted performance.
Subtract the risk-free rate from the portfolio return, then divide the result by the portfolio’s beta:
Treynor Ratio = (Portfolio Return − Risk-Free Rate) / Beta
There is no universal benchmark. However, a positive and consistently high ratio indicates strong risk-adjusted returns. When comparing investments, the one with the higher Treynor Ratio is generally preferred, assuming other factors remain similar.
Calculate your Net P&L after deducting all the charges like Tax, Brokerage, etc.
Find your required margin.
Calculate the average price you paid for a stock and determine your total cost.
Estimate your investment growth. Calculate potential returns on one-time investments.
Forecast your investment returns. Understand potential growth with regular contributions.

You have successfully submitted your partnership request form. You will be hearing us soon!