10 Jul, 2025
 4 mins read
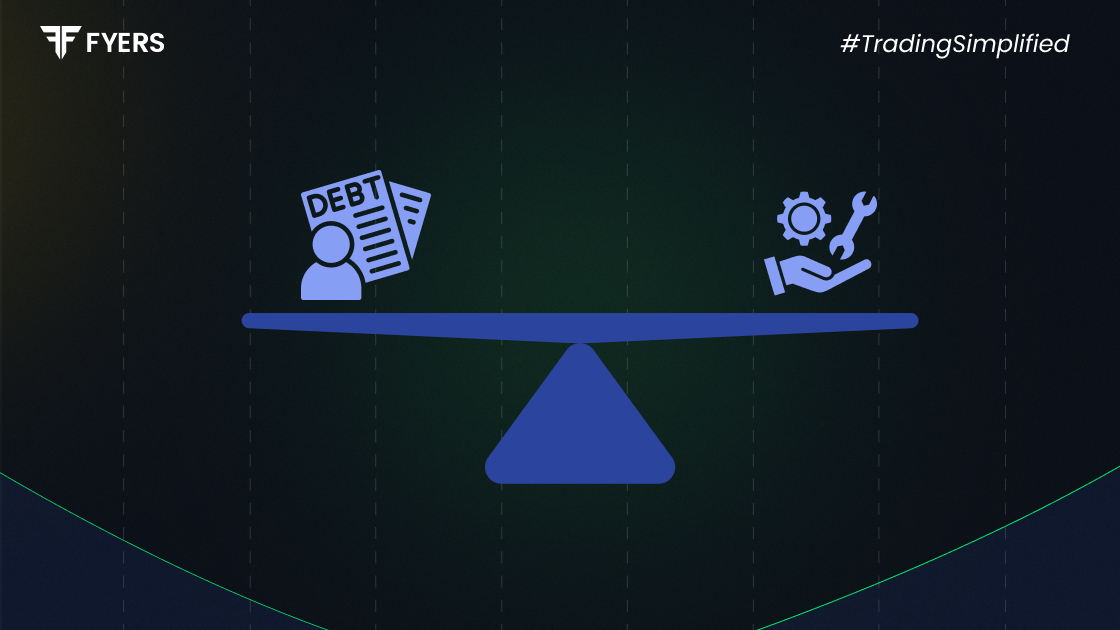
Every business - whether a thriving enterprise or a growing startup - needs to understand when it will start turning a profit. That critical milestone is called the breakeven point. It’s a foundational concept in financial planning that helps entrepreneurs and managers make informed decisions about pricing, budgeting, and profitability.
In this article, we’ll break down what is breakeven point, how to calculate it using the breakeven point formula, explore its benefits, and also address its limitations.
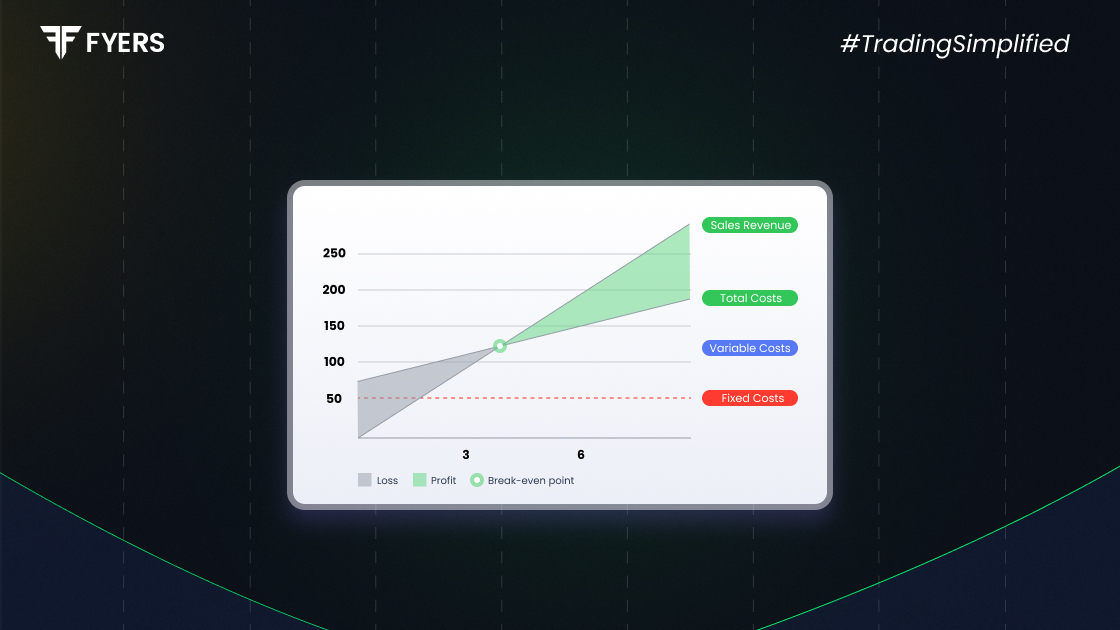
The breakeven point (BEP) refers to the level of sales at which a business’s total revenue equals its total costs - both fixed and variable. At this point, the company is not making any profit or incurring any loss.
Simple Explanation: If your revenue covers all expenses but doesn’t leave a surplus, you’ve reached the breakeven point. Every sale beyond this point contributes to profit.
Understanding the importance of breakeven point is crucial for sustainable business growth. Here's why:
Pricing Strategy: Helps set a minimum price that ensures you don’t sell at a loss.
Profit Planning: Determines how many units must be sold to become profitable.
Budget Forecasting: Aids in setting realistic budgets and managing cost structures.
Investment Evaluation: Assesses the viability of launching new products or services.
Risk Assessment: Gives a clearer view of operational thresholds and safety margins.
Especially for startups and small businesses, break-even analysis is an essential part of early-stage financial modelling.
To understand how to calculate breakeven point, you need to identify three components:
Fixed Costs
These remain constant regardless of output - e.g., rent, salaries, insurance.
Variable Costs per Unit
These fluctuate with production volume - e.g., raw materials, packaging, logistics.
Selling Price per Unit
The amount charged for each unit sold.
The breakeven point formula (in units) is:
|
Breakeven Point = Fixed Costs ÷ (Selling Price per Unit – Variable Cost per Unit) |
This formula calculates the number of units you need to sell to cover all costs.
Breakeven Point Example:
Let’s say:
Fixed Costs = ₹50,000
Selling Price per Unit = ₹500
Variable Cost per Unit = ₹300
Breakeven Point = 50,000 ÷ (500 – 300) = 250 units
So, the business needs to sell 250 units to break even.
Add up all fixed costs (rent, salaries, utilities).
Determine the selling price of your product or service.
Calculate the variable cost per unit.
Plug these into the breakeven formula.
Optional: Multiply the result by the selling price to get the BEP in revenue.
Tools like Excel or online breakeven calculators can automate this process.
Here are some key benefits of breakeven analysis:
Reduces Financial Risk by identifying your survival threshold.
Supports Strategic Decisions like pricing changes or cost-cutting.
Informs Financial Forecasting and goal-setting.
Improves Cost Control by breaking down expenses.
Assists in Launch Planning for new products or services.
While useful, breakeven analysis is not without flaws:
Assumes Constant Prices: Real-world pricing can vary due to discounts or market fluctuations.
Ignores Demand Elasticity: It doesn't reflect whether customers will actually buy at a given price.
Assumes Linear Costs: Not all costs scale linearly with volume.
Overlooks Inventory Dynamics: Assumes everything produced is sold.
Lacks Real-Time Updates: A static breakeven model can quickly become outdated.
To overcome these limitations, combine breakeven analysis with market research, scenario planning, and regular financial reviews.
The breakeven point is more than just a number - it’s a strategic tool that can guide pricing, budgeting, and business development. It tells you how much you need to sell to cover your costs, making it essential for both new ventures and established businesses.
However, it’s important to remember that breakeven is a simplified model. Use it in conjunction with real-world data and market insights to make fully informed business decisions.
It’s the sales level where your revenue equals your expenses - no profit, no loss.
It helps you set pricing, control costs, and determine how much you need to sell to be profitable.
Ideally every quarter or whenever your cost structure or pricing changes.
Calculate your Net P&L after deducting all the charges like Tax, Brokerage, etc.
Find your required margin.
Calculate the average price you paid for a stock and determine your total cost.
Estimate your investment growth. Calculate potential returns on one-time investments.
Forecast your investment returns. Understand potential growth with regular contributions.

You have successfully submitted your partnership request form. You will be hearing us soon!