20 Aug, 2025
 4 mins read
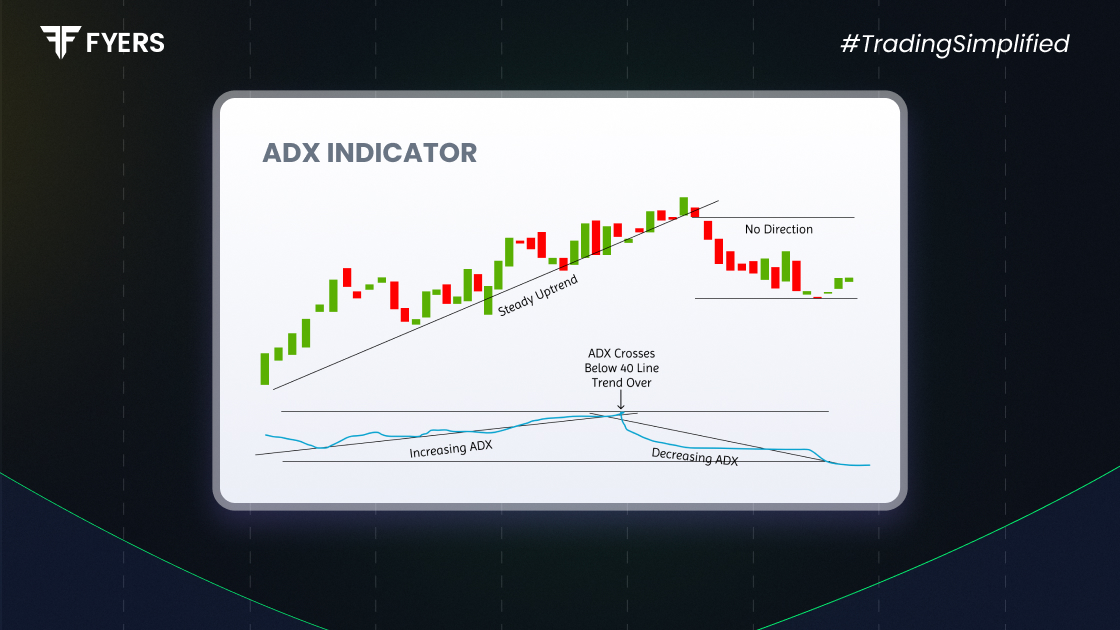
In technical analysis, identifying the direction of a trend is only part of the equation. Equally important is understanding the strength of that trend. This is where the ADX indicator (Average Directional Index) becomes a valuable tool. Whether you're refining your strategy or just starting out, learning the ADX indicator meaning, its components, and applications can significantly improve your market insights.
The ADX indicator, developed by J. Welles Wilder, is designed to quantify the strength of a trend- regardless of whether it is upward or downward. It forms part of the Directional Movement System, along with the +DI and -DI lines.
The ADX value ranges between 0 and 100:
0–25: Weak or no trend
25–50: Moderate to strong trend
50–75: Very strong trend
75–100: Extremely strong trend (rare in most markets)
Unlike many indicators, ADX doesn’t indicate trend direction; it simply measures trend momentum.
Understanding the components of ADX indicator is essential to interpret it correctly. There are three main lines:
ADX Line: Reflects the strength of the trend. A rising ADX suggests increasing momentum.
+DI (Positive Directional Indicator): Indicates the strength of upward price movement.
-DI (Negative Directional Indicator): Measures the strength of downward price movement.
When the +DI is above the -DI, bullish pressure dominates. Conversely, when -DI exceeds +DI, bearish strength is higher.
Here’s a breakdown of how ADX indicator works:
It typically uses a 14-period calculation (on daily or intraday charts).
It compares the current highs and lows to prior periods to derive +DI and -DI.
The ADX line is calculated as a smoothed moving average of the Directional Movement Index.
Suppose ADX is at 20- this signals a non-trending or sideways market. If it rises above 25, a new trend may be gaining strength. A value above 40 typically signals a robust trend.
Applying the ADX indicator trading strategy requires understanding both trend strength and context. Here are some common methods:
Use ADX to validate potential breakouts or patterns. A breakout supported by ADX above 25 is considered stronger.
A bullish entry signal occurs when +DI crosses above -DI and ADX is rising above 25.
A bearish signal occurs when -DI overtakes +DI with rising ADX.
Consider exiting or avoiding trades when ADX is below 20, indicating a lack of trend.
Pair ADX with tools like RSI, MACD, or moving averages to confirm trend conditions.
ADX below 20 suggests range-bound markets, where trend-following strategies may fail.
Evaluating the pros and cons of ADX indicator use will help in applying it more effectively:
Quantifies Trend Strength: Helps focus on trades with higher trend conviction.
Versatile Application: Works well across asset classes and timeframes.
Reduces Whipsaws: By filtering weak trends, it reduces false entries.
Lagging Nature: Since it is based on historical prices, signals can be delayed.
No Directional Signal from ADX Alone: Requires reading in conjunction with +DI and -DI.
Can Be Misleading in Choppy Markets: May give conflicting signals without context.
Avoid these pitfalls when using ADX:
Using ADX in Isolation: It should complement other technical tools and price action.
Misreading Flat ADX: A flat or falling ADX doesn’t mean reversal - it signals trend weakening.
Ignoring Crossovers: Overlooking the interaction between +DI and -DI can lead to poor decision-making.
Inconsistent Timeframes: Use an ADX period that aligns with your trading strategy (daily for swing, intraday for short-term trades).
The ADX indicator offers a structured way to evaluate trend strength, which is essential for timing entries and exits. While it doesn’t reveal the direction on its own, when paired with +DI and -DI, it becomes a powerful trend-trading tool. Understanding how ADX indicator works and using it with complementary indicators helps traders avoid uncertain conditions and prioritise strong market moves. It’s a versatile and trusted part of many trading systems
The ADX indicator shows the strength of a market trend, regardless of its direction.
An ADX value above 25 usually indicates a strong trend and is considered suitable for trading.
It’s not recommended. While ADX is useful for identifying trend strength, combining it with other indicators improves reliability.
The ADX works well on daily charts for swing trading, but can also be used on shorter timeframes with proper risk management.
Calculate your Net P&L after deducting all the charges like Tax, Brokerage, etc.
Find your required margin.
Calculate the average price you paid for a stock and determine your total cost.
Estimate your investment growth. Calculate potential returns on one-time investments.
Forecast your investment returns. Understand potential growth with regular contributions.
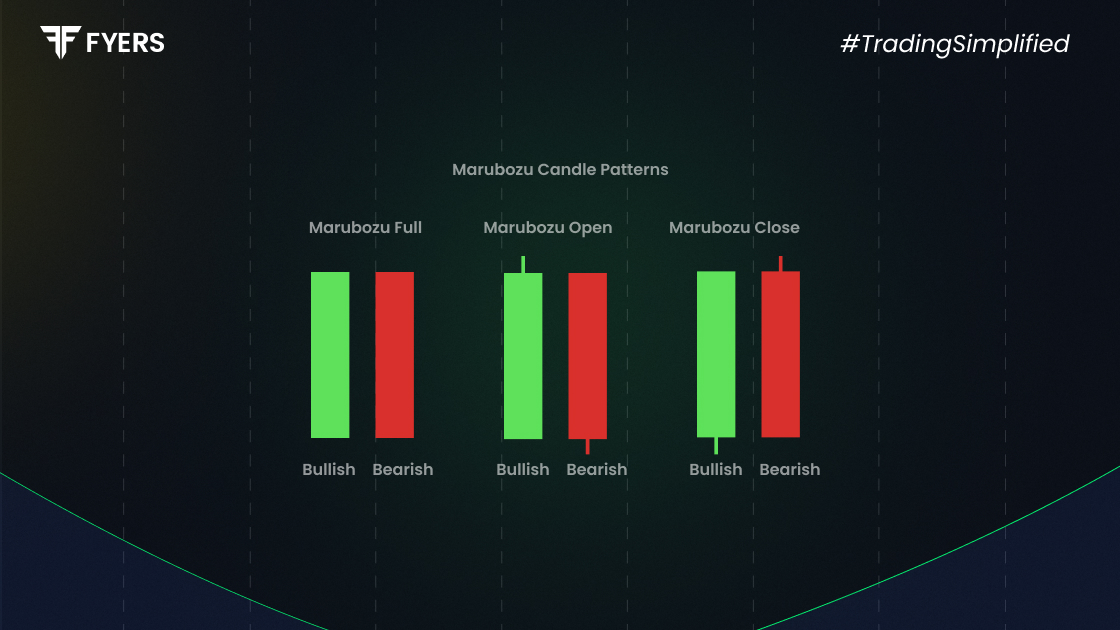
The Marubozu candlestick pattern is a simple yet powerful indicator…
20 Aug, 2025
6 mins read

You have successfully submitted your partnership request form. You will be hearing us soon!