17 Sep, 2025
 3 mins read
Candlestick charts are one of the most widely used tools in technical analysis. Among the many reversal signals, the piercing line candlestick is considered important for spotting potential trend changes. This pattern often appears after a downtrend and suggests that buyers are attempting to regain control.
In this blog, we’ll explore what is a piercing pattern, how it forms, its signals, and the pros and cons of using it in trading decisions.
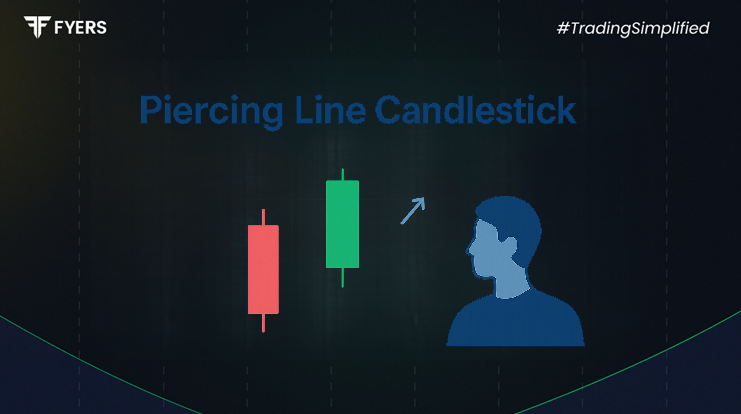
The piercing candlestick pattern is a two-candle formation that signals a possible reversal from a bearish to a bullish trend.
The first candle is a long red candle showing strong selling pressure.
The second candle is a green candle that opens below the previous day’s low but closes above the midpoint of the red candle.
This setup creates the impression that buyers are stepping back in, making it a classic bullish piercing pattern.
For a valid piercing setup to occur:
The market should be in a downtrend or coming off a decline.
The first candle must be a strong bearish candle with a long body.
The next day’s candle must open lower (a gap down) but then close above the midpoint of the previous candle’s body.
This price action indicates that sentiment is shifting, as buyers manage to reclaim lost ground despite a bearish opening.
Common and widely recognised.
Indicates a potential reversal to the upside.
Stronger when supported by high trading volume or other technical indicators.
Less common, sometimes seen as a mirror image but with weaker reliability.
Traders often confuse it with other bearish reversal setups like dark cloud cover.
In general usage, the piercing pattern is considered bullish.
When spotted correctly, the piercing line candlestick may indicate:
Potential Trend Reversal: Buyers are regaining control after a sell-off.
Market Sentiment Shift: From bearish to bullish.
Entry Point for Traders: Many traders look for long positions once the pattern forms.
To avoid false signals, traders confirm the setup using tools like moving averages, RSI, or support and resistance levels.
Easy to Identify: Simple two-candle formation.
Reliable in Downtrends: Often marks the beginning of an upward move.
Strong Bullish Indicator: Especially when accompanied by volume.
Helps in Early Entries: Can provide traders with a timely opportunity to enter long trades.
Despite its usefulness, the piercing candlestick pattern has certain drawbacks:
Not Always Reliable: False signals can occur in sideways or highly volatile markets.
Confirmation Needed: Works best when combined with other indicators.
Short-Term Signal: May not always result in a long-lasting reversal.
Limited Bearish Use: The bearish piercing candlestick pattern is weak compared to other reversal formations.
Traders often integrate the piercing pattern into their strategies by:
Looking for the pattern near support zones for stronger confirmation.
Checking volume levels—a high-volume green candle adds credibility.
Combining with indicators like RSI or MACD for confirmation.
Setting stop-loss levels just below the pattern’s low to manage risks.
The piercing line candlestick is a widely followed reversal pattern that signals a potential shift from bearish to bullish sentiment. While it provides valuable insight into market psychology, it should not be used in isolation. Traders must always confirm the setup with additional indicators and proper risk management.
For investors and traders, understanding the formation, advantages, and limitations of this candlestick pattern can enhance decision-making and improve entry points in trending markets.
It is a two-candle bullish reversal pattern where a green candle closes above the midpoint of the previous red candle after a downtrend.
The piercing pattern is primarily bullish, signalling a potential upside reversal.
By checking trading volume, support levels, and using technical indicators like RSI or moving averages.
It may give false signals in sideways markets, requires confirmation, and is less effective as a bearish indicator.
Calculate your Net P&L after deducting all the charges like Tax, Brokerage, etc.
Find your required margin.
Calculate the average price you paid for a stock and determine your total cost.
Estimate your investment growth. Calculate potential returns on one-time investments.
Forecast your investment returns. Understand potential growth with regular contributions.

You have successfully submitted your partnership request form. You will be hearing us soon!