30 Sep, 2025
 4 mins read
Candlestick charts are one of the most widely used tools in technical analysis. They not only reflect price movement but also capture market sentiment. Among the numerous candlestick patterns, the dark cloud cover pattern stands out as an important bearish reversal signal. Traders often rely on it to anticipate potential market downturns after a strong uptrend.
This article explores how the pattern forms, its main features, the psychology driving it, strategies for trading, and its limitations.
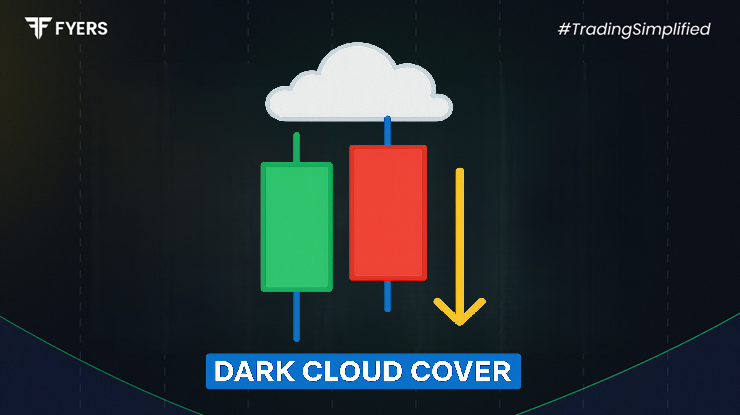
The dark cloud candlestick formation occurs during an uptrend and signals a possible shift in momentum from buyers to sellers. It involves two candlesticks:
First candle (bullish) – A long green candle forms, reflecting strong buying pressure and continuation of the uptrend.
Second candle (bearish) – The next day, the market opens above the previous close (a gap up), but instead of continuing higher, sellers take control. The candle closes deep into the body of the previous bullish candle, usually beyond the midpoint.
This sudden reversal creates the dark cloud effect—where the second candle “casts a shadow” on the prior bullish optimism.
To correctly identify the dark cloud cover candlestick pattern, traders look for the following characteristics:
Appears after a clear uptrend, making it a potential reversal signal.
The first candle must be long and bullish, confirming strong upward momentum.
The second candle opens higher than the previous close (gap up).
The second candle then closes below the midpoint of the first candle, showing strong selling pressure.
Ideally, the pattern forms near a resistance zone or after a prolonged rally, increasing its reliability.
Without these characteristics, the signal may be weaker or misleading.
Candlestick patterns capture market psychology, and the dark cloud pattern is no exception.
On the first day, buyers dominate, driving prices upward. Optimism is high, and traders expect the rally to continue.
The next day starts strong with a gap up, which initially reinforces bullish confidence.
However, selling pressure quickly builds. The long bearish candle suggests that sellers have overwhelmed buyers.
Closing below the midpoint of the earlier bullish candle signals a significant shift in sentiment from bullish to bearish.
In short, the dark cloud cover reflects a tug-of-war where sellers decisively regain control, warning traders of a possible trend reversal.
Traders often use the dark cloud cover trading strategy in combination with other tools to confirm reversal signals. A simple approach involves:
Identify the pattern after an established uptrend.
Look for confirmation on the following sessions, such as a further decline in price or increased trading volume.
Enter a short position when the price breaks below the low of the second candle.
Set stop-loss orders slightly above the high of the bearish candle to manage risk.
Target levels can be identified near previous support zones or through technical indicators like moving averages.
Some traders also combine the pattern with RSI, MACD, or moving averages to filter out false signals.
In Indian markets, the dark cloud candlestick formation often appears in large-cap stocks after prolonged rallies. For instance, a stock in the Nifty 50 might rally for several sessions, form a long bullish candle, and then display the bearish pattern near a resistance level.
International examples include occurrences in the S&P 500 index during periods of overbought conditions, where the reversal led to short-term corrections.
By studying historical charts, traders can see how the pattern works in practice and refine their trading decisions accordingly.
The dark cloud candlestick pattern can be confused with other bearish formations. Key differences include:
Bearish Engulfing vs Dark Cloud Cover: In a bearish engulfing, the second candle completely covers the first candle’s body. In contrast, the dark cloud cover closes below the midpoint but not necessarily fully engulfing.
Evening Star vs Dark Cloud Cover: An evening star involves three candles (bullish, small-bodied, and bearish), while the dark cloud uses only two.
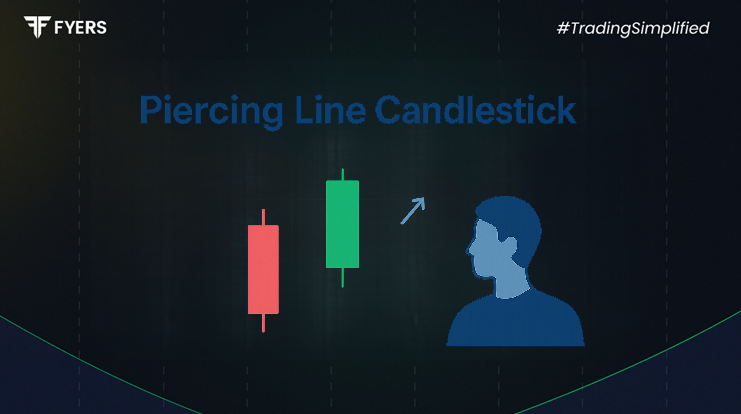
Piercing Line (Bullish Counterpart): The piercing line is the opposite of the dark cloud cover. It forms in a downtrend, where a bullish candle closes above the midpoint of the prior bearish candle.
Recognising these differences helps avoid misinterpretation.
While widely used, the dark cloud cover pattern is not foolproof. Its limitations include:
Works best only after a clear uptrend; in sideways markets, it may give false signals.
Requires confirmation from subsequent price action or technical indicators to increase reliability.
Not always effective in highly volatile markets where frequent gap-ups and reversals occur.
Risk of false positives, especially if trading volume is low during the pattern’s formation.
For this reason, traders rarely rely on the pattern in isolation.
The dark cloud cover pattern is a valuable bearish reversal signal in candlestick charting. By understanding its formation, psychology, and trading strategy, investors can use it to anticipate potential downturns after an uptrend. However, like all technical tools, it should be applied alongside other indicators and risk management practices for greater accuracy.
When studied carefully, this candlestick formation can help traders identify opportunities to protect profits, manage risks, and make better-informed decisions.
It is a two-candle bearish reversal formation that appears after an uptrend. The second candle opens higher but closes deep into the first bullish candle, signaling selling pressure.
It can be reliable when confirmed with indicators like RSI or volume. However, in choppy or sideways markets, it may give false signals.
In a bearish engulfing, the second candle fully covers the first candle’s body. In a dark cloud cover, the bearish candle closes below the midpoint but does not completely engulf the first candle.
Traders often short below the low of the bearish candle with stop-loss above its high, targeting support levels or using indicators for confirmation.
Calculate your Net P&L after deducting all the charges like Tax, Brokerage, etc.
Find your required margin.
Calculate the average price you paid for a stock and determine your total cost.
Estimate your investment growth. Calculate potential returns on one-time investments.
Forecast your investment returns. Understand potential growth with regular contributions.

You have successfully submitted your partnership request form. You will be hearing us soon!