29 Apr, 2025
 6 mins read
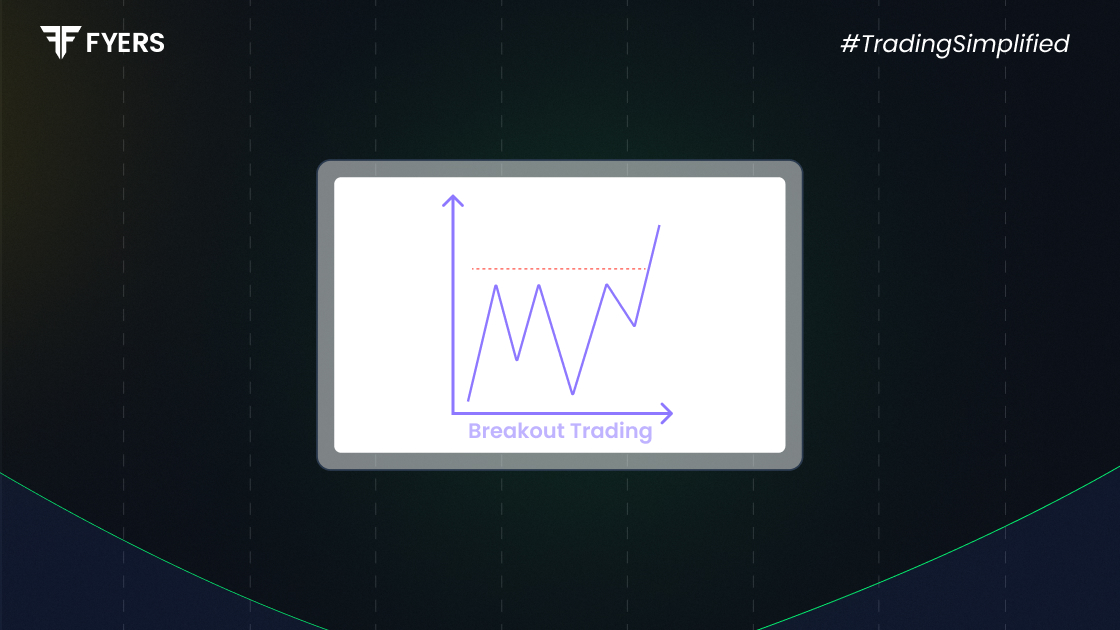
Breakout trading identifies opportunities when the price moves beyond established support or resistance levels with increased volume. This powerful strategy signals a potential change in trend and new momentum in the market. This article will explain breakout trading, the types, and the indicators to spot this opportunity.
A breakout occurs when the price of a financial instrument (like a stock, forex pair, or commodity) moves beyond an established support or resistance level with increased trading volume. This price action typically signals a significant shift in market sentiment and potentially marks the beginning of a new trend direction.
Key elements of breakout trading include:
Support and resistance levels: These are price points where a security has historically had difficulty moving beyond. Support levels prevent prices from falling further, while resistance levels prevent prices from rising higher.
Consolidation periods: Breakouts often follow periods of price consolidation, where the asset trades in a narrow range between support and resistance.
Volume confirmation: True breakouts are usually accompanied by higher trading volume, confirming market participation in the new direction.
Entry timing: Traders enter positions when price convincingly breaks through these levels, anticipating that momentum will continue in the breakthrough direction.
Risk management: Stop-loss orders are typically placed just beyond the broken level in case the breakout fails (known as a "false breakout" or "fakeout").
Breakout strategies can be applied across various timeframes (from minutes to months) and across all liquid markets, including stocks, indices, forex, and commodities.
Several breakout types exist, each linked to different chart patterns:
Horizontal Breakouts: Occurs when the price breaks through flat support or resistance after range-bound trading.
Triangle Breakouts: These can be ascending (breaks above horizontal resistance), descending (breaks below horizontal support), or symmetrical (converging trend lines with breakouts possible in either direction).
Flag and Pennant Breakouts: Formed after sharp price movements when the price consolidates in a small range. A breakout often continues the previous trend.
Head and Shoulders Breakout: Signals a reversal when the price moves beyond the neckline after forming three peaks.
Trendline Breakouts: This happens when the price breaks above or below a trendline drawn across highs or lows, suggesting a possible trend change.
To implement breakout trading effectively:
Identify periods where the price moves within a tight range with clear boundaries.
Draw support and resistance lines where the price has repeatedly bounced or failed to break through.
Monitor these levels for decisive moves beyond the boundaries.
Verify increased trading volume accompanying the breakout.
Place buy orders when the price breaks above resistance or sell orders when it breaks below support.
For long positions, place your stop-loss just below the breakout point. And for short positions, set it just above.
Establish clear profit targets based on previous price swings or technical indicators.
As the trade moves in your favor, adjusting the stop-loss helps lock in gains and manage risk.
Close positions when the price reaches targets, shows reversal signs, or hits stop-loss.
Successful breakout traders rely on several specialized tools and indicators to identify, confirm, and execute trades effectively. Here are some of them
Chart Patterns:
Rectangle patterns, triangles, flags, and pennants that show consolidation before breakouts.
Head and shoulders, double/triple tops and bottoms for reversal breakouts.
Cup and handle formations signal potential upside breakouts.
Indicators:
Bollinger Bands to identify periods of low volatility before breakouts (squeezes).
Average True Range (ATR) for measuring volatility increases during breakouts.
Volume indicators to confirm legitimate breakouts (like On-Balance Volume or Volume Profile)
Moving averages to identify key support/resistance levels
Order Types:
Stop orders that activate only when price breaks through a specific level
Limit orders for entry after small retracements following initial breakouts
Trailing stops to protect profits while letting winners run
Position Sizing Calculators:
Risk management tools that determine appropriate position size based on account size and stop distance
Stock/Market Scanners:
Tools that filter markets for securities approaching key levels
Volume surge detectors that flag unusual trading activity
Relative strength scanners to find outperforming securities
Alerts:
Price alerts when securities approach key levels
Volume alerts when trading activity increases significantly
Mobile notifications for when you're away from your trading station
Stop-Loss Calculators:
Tools that help determine optimal stop-loss placement based on market volatility
Maximum drawdown calculators
Software to track breakout success rates and performance metrics
Pattern recognition tools to identify which breakout setups work best for your trading style
The most effective breakout traders combine these tools with a disciplined approach to pattern recognition, risk management, and proper trade execution rather than relying on any single indicator.
For instance, a technology stock trades between ₹5000 and ₹5100 for several weeks. The ₹5100 level acts as strong resistance. You identify this range and wait. One day, the stock breaks above ₹5100 with high volume. You enter a long position just above ₹5100 and set a stop-loss slightly below this level. Moving averages are often used as dynamic levels for setting profit-taking targets. As the stock rises, you book partial profits and adjust your stop-loss to secure gains.
This approach helps you capture momentum while managing risk effectively.
Price Action Breakout focuses on chart patterns and price behavior without indicators. You watch how price acts near key levels and make decisions based on candlestick patterns alone. This approach helps you avoid indicator lag and focus on direct market movements.
Volume Breakout requires significant volume increases with price breaks. You only enter when the price crosses a key level with a volume higher than recent averages. This filters out many false breakouts by confirming real market conviction.
Moving Average Breakout uses MA crossovers to confirm breakouts. You enter when the price breaks above a key moving average or when a short-term average crosses above a longer one. This helps you find breakouts aligned with the broader trend.
In Opening Range Breakout strategies, trades are triggered when the price breaks past the high or low established during the early minutes of trading. Mark the high and low of the first 15-30 minutes and enter if the price breaks out of this range—ideal for intraday opportunities.
News-Based Breakout targets the price moves after announcements. You prepare for stocks with upcoming events and enter if the price breaks important levels after the news. This captures the volatility that typically follows significant company developments.
High return potential when breakouts are genuine and momentum continues.
The strategy uses clear technical levels, making it less subjective and easier to follow.
You can apply breakout approaches across various markets including stocks, indices, and commodities.
False breakouts happen when the price breaks a key level but quickly reverses. This causes losses.
Market volatility can trigger stop-losses and result in frequent losses.
Trading costs may accumulate from frequent transactions.
Breakout trading leverages price momentum and market psychology. By understanding breakout patterns and using proper indicators, you can improve your trading success. However, the strategy carries risks, especially from false breakouts. Success requires proper risk management, disciplined execution, and continuous learning.
The main types of breakouts in trading include horizontal breakouts, triangle breakouts (ascending, descending, symmetrical), flag and pennant breakouts, and head and shoulders breakouts. Each type is associated with specific chart patterns and signals different market scenarios.
You can spot a breakout by observing an increase in trading volume and price movement beyond. Using technical indicators like RSI and MACD, along with monitoring candlestick patterns and volume, can help distinguish real breakouts from false ones.
Breakout trading can be suitable for beginners if they focus on simple breakout patterns, use proper risk management, and avoid overtrading. It is important to start with basic strategies, practice on a demo account, and gradually gain experience before trading with real money.
Calculate your Net P&L after deducting all the charges like Tax, Brokerage, etc.
Find your required margin.
Calculate the average price you paid for a stock and determine your total cost.
Estimate your investment growth. Calculate potential returns on one-time investments.
Forecast your investment returns. Understand potential growth with regular contributions.

You have successfully submitted your partnership request form. You will be hearing us soon!