30 Sep, 2025
 4 mins read
Candlestick charts are one of the most widely used tools in technical analysis. Traders rely on them to read price action, spot reversals, and confirm trends. Among the various formations, a single candlestick pattern is the simplest yet often highly effective in signaling potential market movements. Despite their simplicity, these patterns carry valuable insights into market psychology.
In this article, we’ll explain what single candlestick patterns are, the different types, how to interpret them, and how traders can use them in trading strategies.
A single candlestick pattern is a chart formation created by just one candlestick, which can provide hints about the market’s next move. Unlike multi-candle patterns that require confirmation from several sessions, single candlestick formations are based on one trading period’s open, high, low, and close prices.
They are especially useful in spotting potential reversals, continuation signals, or indecision points. Traders often use them in combination with trendlines, support and resistance levels, or other indicators for better accuracy.
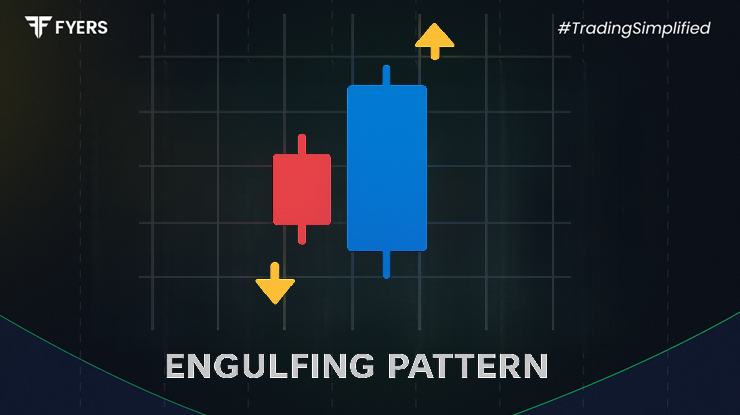
Single candlestick patterns can broadly be classified into two groups:
Bullish Single Candlestick Patterns – Indicating potential upward reversals or buying opportunities.
Bearish Single Candlestick Patterns – Suggesting possible downward reversals or selling signals.
These types help traders quickly identify whether the market sentiment is turning positive or negative.
Some of the most common bullish single candlestick patterns include:
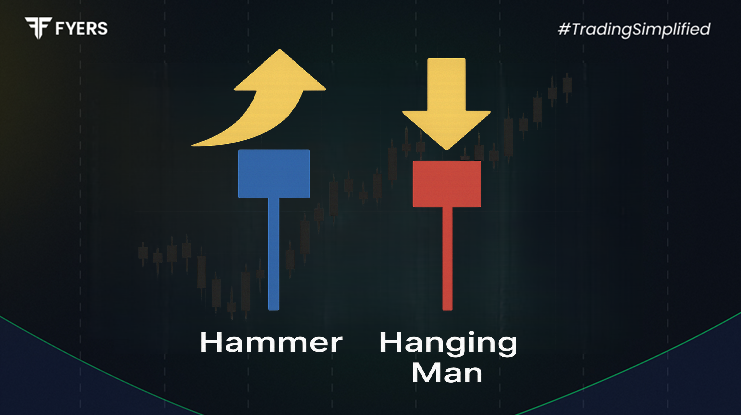
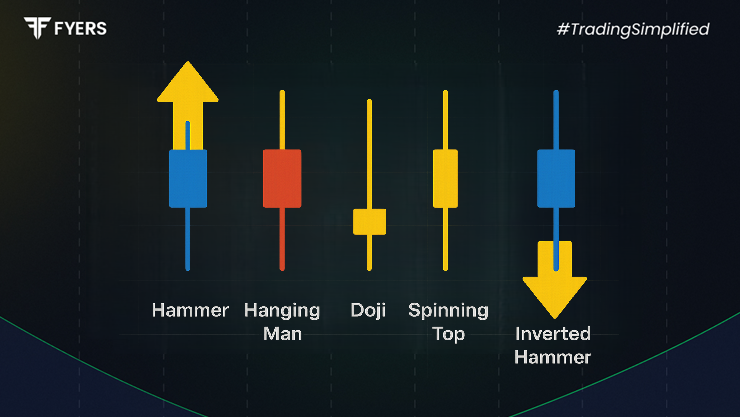
Hammer: Appears after a downtrend, with a small body and a long lower shadow, indicating potential buying interest.
Dragonfly Doji: Signals a bullish reversal when found at the bottom of a downtrend, showing that sellers failed to push prices down.
Inverted Hammer: Looks like a shooting star but appears at the bottom of a downtrend, hinting at a possible upward reversal.
These patterns suggest that buyers may be regaining control after a period of selling.
Common bearish single stick patterns include:
Hanging Man: Appears at the top of an uptrend, resembling the hammer but signaling selling pressure.
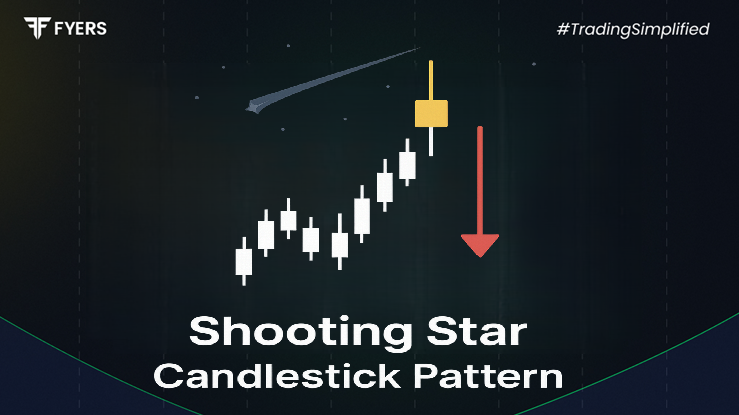
Shooting Star: A small body with a long upper shadow, often seen at the top of an uptrend, indicating that buyers failed to sustain higher prices.
Gravestone Doji: Suggests bearish reversal when it occurs after a strong upward move, showing buyers lost momentum.
These patterns alert traders that a bullish phase might be weakening.
When reading a single candle pattern chart, traders focus on:
The position of the pattern in the existing trend (uptrend, downtrend, or sideways).
The size of shadows and body, which reflects market strength and rejection levels.
The volume, which adds weight to the candlestick’s reliability.
For example, a hammer after a strong downtrend is more meaningful than one appearing in a sideways market.
A single candlestick pattern trading strategy often involves:
Trend Context: Confirm whether the candlestick appears in an uptrend, downtrend, or range.
Confirmation: Wait for the next candle to validate the reversal signal.
Support and Resistance: Combine the pattern with critical price levels for stronger signals.
Risk Management: Place stop-loss orders below or above the pattern’s shadow to minimize risk.
For instance, if a hammer forms near a strong support zone, traders may consider entering a long position with a stop-loss below the low.
Practical examples include:
A shooting star appearing after a prolonged rally in a stock, indicating potential profit-taking.
A hammer forming after a sharp market decline, showing buyers stepping back in.
A doji surfacing during consolidation, suggesting indecision before the next breakout.
Analyzing real stock charts helps traders understand how reliable these single stick patterns can be in different scenarios.
Simple and easy to spot.
Provide quick insights into price action.
Work well when combined with other tools.
Not always reliable when used in isolation.
May generate false signals in volatile or sideways markets.
Require confirmation from subsequent candles or indicators.
Thus, while single candlestick formations are useful, traders should avoid using them as the sole basis for decisions.
A single candlestick pattern is a straightforward yet insightful charting tool in technical analysis. Whether bullish or bearish, these patterns give traders a glimpse into market psychology and potential reversals. By understanding their formation, interpreting them within the context of trends, and combining them with other indicators, traders can improve their decision-making.
It is a chart formation created by a single candlestick, often used to signal potential reversals or continuation of trends.
Hammers, inverted hammers, and dragonfly dojis are common bullish single candlestick patterns.
They can be reliable when analysed within the right market context and confirmed with other indicators, but they should not be used in isolation.
Yes, many intraday traders use them to spot short-term reversals or entry points, especially when combined with support and resistance zones.
Calculate your Net P&L after deducting all the charges like Tax, Brokerage, etc.
Find your required margin.
Calculate the average price you paid for a stock and determine your total cost.
Estimate your investment growth. Calculate potential returns on one-time investments.
Forecast your investment returns. Understand potential growth with regular contributions.

You have successfully submitted your partnership request form. You will be hearing us soon!