25 Sep, 2025
 3 mins read
In trading, patterns often tell stories about market psychology. Among them, the tweezer top stands out as a clear warning sign. When prices rally and then suddenly struggle at the same high two sessions in a row, it signals hesitation in the market. This hesitation, shaped into two matching candle peaks, often marks the point where bulls lose steam and bears step in. For traders, recognising this pattern can mean the difference between holding onto fading profits and making a timely exit.
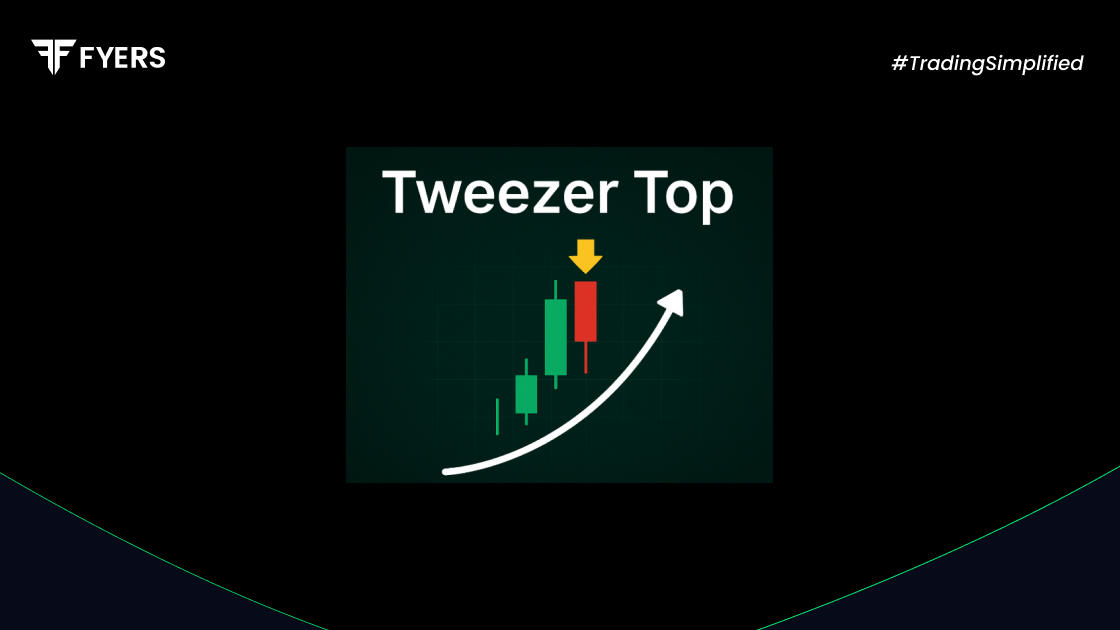
The tweezer top candlestick pattern is a bearish reversal signal that forms after an uptrend. It consists of two consecutive candles with similar highs, showing that the price is unable to break higher.
This pattern reveals a tug-of-war between buyers and sellers, where buyers push the price up but cannot maintain control. Sellers then step in, reversing momentum and signalling the possibility of a downturn.
The tweezer top candle pattern typically develops across two trading sessions:
First Candle: A bullish candle that continues the uptrend, usually with a strong body.
Second Candle: A bearish candle that opens at or near the previous high and closes lower, with a high matching the first candle.
This creates the appearance of a pair of tweezers. Confirmation is stronger when:
The pattern forms near a resistance level
Volume increases during the second candle
Indicators like RSI show overbought conditions
Trading the tweezer top pattern involves both identification and confirmation. A careful approach includes:
Spot the pattern: Identify two consecutive candles with equal or nearly equal highs after an uptrend.
Wait for confirmation: Look for a third bearish candle or a break below support.
Enter a short position: Once confirmed, enter a sell trade with proper risk management.
Set stop-loss: Place it just above the pattern’s high.
Set profit targets: Aim for recent support levels or use risk-reward ratios.
Enhancing the strategy with tools like MACD, RSI, or moving averages can help reduce false signals.
The Tweezer Top has a bullish counterpart called the Tweezer Bottom. Here is a quick comparison:
|
Feature |
Tweezer Top |
Tweezer Bottom |
|---|---|---|
|
Trend Direction |
Appears after an uptrend |
Appears after a downtrend |
|
Signal |
Bearish reversal |
Bullish reversal |
|
First Candle |
Bullish |
Bearish |
|
Second Candle |
Bearish |
Bullish |
|
Trading Action |
Consider shorting or booking profits |
Consider buying or entering long |
Understanding both enhances a trader’s ability to react to shifts in market momentum.
Benefits
Provides early warning of potential reversals
Easy to spot due to its symmetrical highs
Works across timeframes, from intraday to weekly charts
Complements other technical indicators effectively
Drawbacks
Prone to false signals in strong uptrends
Requires confirmation before acting
Less reliable when volume is weak
The tweezer top pattern is more than just a visual signal. It reflects a deeper market struggle where bullish strength meets resistance and loses ground to sellers. While not flawless, it can help traders lock in profits and prepare for a potential reversal when combined with confirmation tools. Whether used in short-term trading or longer-term analysis, mastering the tweezer top meaning and recognising it in real time can give traders an edge in volatile markets.
No. While it often signals a bearish reversal, it should always be confirmed with indicators such as RSI, volume, or trendline breaks.
A Tweezer Top consists of two candles. The first is usually bullish, and the second bearish, with both showing nearly identical highs.
Yes, it can be applied in intraday or short-term charts. However, shorter timeframes tend to produce more false signals, making confirmation critical.
Yes. A spike in volume during the second bearish candle strengthens the pattern and signals stronger selling pressure.
Calculate your Net P&L after deducting all the charges like Tax, Brokerage, etc.
Find your required margin.
Calculate the average price you paid for a stock and determine your total cost.
Estimate your investment growth. Calculate potential returns on one-time investments.
Forecast your investment returns. Understand potential growth with regular contributions.

You have successfully submitted your partnership request form. You will be hearing us soon!