28 Jul, 2025
 4 mins read
Candlestick patterns offer visual insights into market psychology, helping traders make more informed decisions. Among these patterns, the spinning top is a unique formation that suggests indecision in the market. This blog explores what a spinning top candlestick pattern signifies, its types, and how it can be used to refine trading strategies.
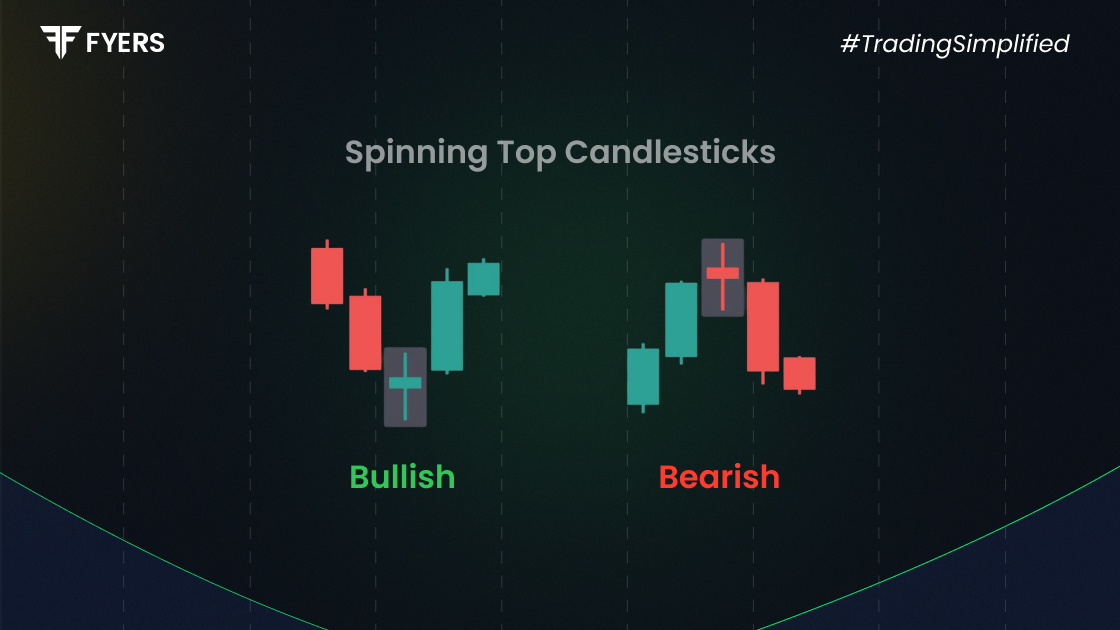
A spinning top is a candlestick pattern that represents market indecision. It forms when the opening and closing prices are very close, but both the upper and lower wicks (shadows) are relatively long. This suggests that neither buyers nor sellers had full control during the trading session.
This pattern may appear during uptrends or downtrends and can be a sign of a potential reversal or pause in market movement. While not a strong standalone signal, it gains relevance when seen in conjunction with other indicators or chart patterns.
The key components of a spinning top candlestick include:
Small Real Body: Indicates minimal difference between the opening and closing prices.
Long Upper Shadow: Shows the price moved significantly higher during the session.
Long Lower Shadow: Indicates that prices also moved substantially lower.
These characteristics reflect uncertainty or a tug-of-war between buyers and sellers.
|
Component |
Description |
|---|---|
|
Real Body |
Small, near the centre of the candle |
|
Upper Shadow |
Relatively long, showing upward price movement |
|
Lower Shadow |
Also long, showing downward price movement |
There are two main types of spinning top candles:
Occurs during a downtrend and may signal a potential reversal or pause. While the candle shows indecision, its appearance after a strong downtrend could indicate that selling pressure is weakening.
Forms during an uptrend and could suggest that the upward momentum is fading. It does not confirm a reversal on its own but highlights a moment of uncertainty among buyers.
Both types should be analysed in the context of the overall market trend and other technical indicators for better reliability.
A spinning top represents a standoff. Both bulls and bears push prices higher and lower during the session, but neither side can maintain control. As a result, the price closes near where it opened.
This pattern indicates hesitation or uncertainty in the market. It could mean that traders are awaiting key data, reacting to news, or simply taking a pause after a strong price move. Depending on the context, a spinning top can lead to continuation or reversal of the prevailing trend.
Trading based on the spinning top pattern requires confirmation from other tools or indicators. Here are steps to consider:
Identify the Trend: Look at the broader market direction.
Spot the Spinning Top: Find the candle within the context of that trend.
Wait for Confirmation: Use the next few candles or indicators like RSI or MACD.
Set Entry and Exit Points: Use support/resistance levels to define your strategy.
Use Stop-Loss Orders: Protect your capital against false signals.
A spinning top alone should not be used as a buy or sell signal. It's best employed as a cue to watch the market more closely.
Imagine a strong downtrend in the Nifty 50, followed by a spinning top. The next day, a bullish engulfing candle forms. This suggests a potential trend reversal. A trader might enter a long position with a stop-loss below the spinning top's low.
In an ongoing uptrend, a spinning top appears but is followed by a bullish candle with strong volume. This may indicate that the uptrend will continue, and traders could use it to add to their existing positions.
By reviewing such examples on real-time charts, traders can get a clearer understanding of when a spinning top is meaningful.
The spinning top candlestick pattern is a visual representation of market indecision. While it does not provide strong directional clues on its own, its true value lies in the context within which it appears. By combining spinning tops with other chart patterns and technical indicators, traders can make more informed decisions. It serves as a useful signal to pause, reassess, and prepare for possible changes in market momentum.
A spinning top indicates indecision in the market. It means both buyers and sellers were active during the session, but neither could dominate. This results in a close price near the opening price, with long upper and lower shadows. It often signals a pause or potential reversal in trend.
While both patterns indicate indecision, a doji has an even smaller real body, sometimes almost non-existent. In a doji, the open and close prices are nearly identical. A spinning top, in contrast, has a small but visible body. The market uncertainty reflected is similar, but a doji suggests an even stronger deadlock.
A spinning top is most effective at the end of a strong trend, either up or down. When it appears after a prolonged move, it could suggest that the trend is weakening. Combined with confirmation signals, it can be a useful tool for identifying potential reversals or pauses.
Calculate your Net P&L after deducting all the charges like Tax, Brokerage, etc.
Find your required margin.
Calculate the average price you paid for a stock and determine your total cost.
Estimate your investment growth. Calculate potential returns on one-time investments.
Forecast your investment returns. Understand potential growth with regular contributions.

You have successfully submitted your partnership request form. You will be hearing us soon!