10 Jul, 2024
 5 mins read
Stock trading is often categorised as a short-term assessment of the market. Traders use various technical analysis tools to make sense of market movements and take advantage of volatility. Moving averages are one of the most commonly used technical indicators by traders to understand stock prices and make suitable trading decisions. So what is a moving average, and why is it so important? Learn all about this indicator in this blog and refine your trading skills.
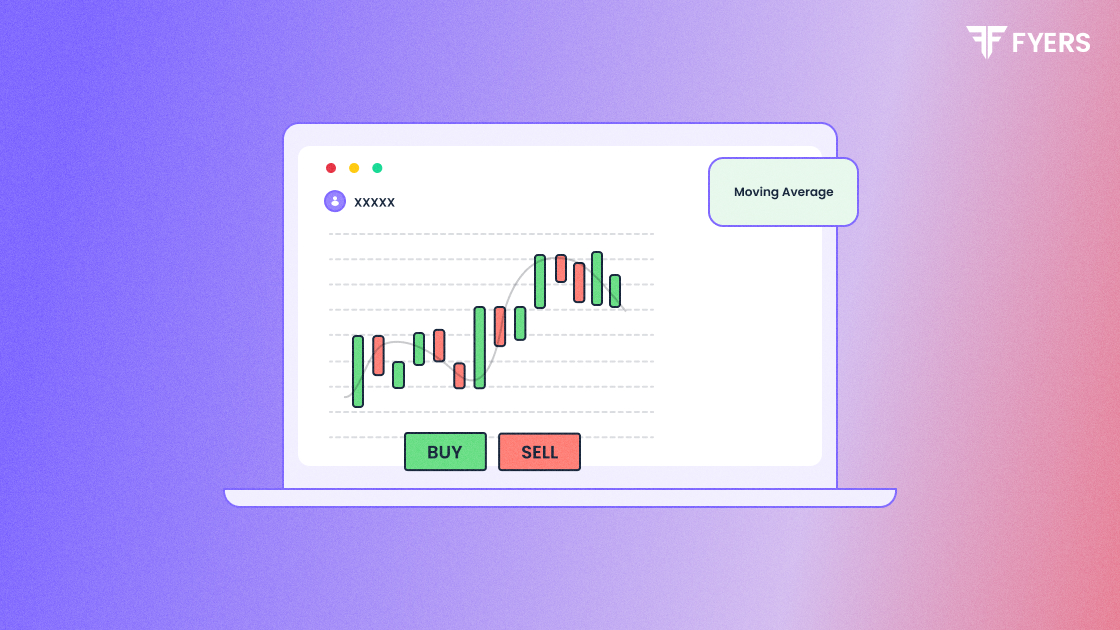
A moving average is a popular technical indicator used to smooth out the price data and helps traders identify trends and suitable entry/exit points for successful trades. It calculates the average price of the asset over a set period (like days or weeks) providing traders with a clearer view of the market direction. This lagging indicator is effective in trending markets rather than a range-bound market where the prices are more or less stable.
Traders can use different types of moving averages to better analyse the market. Here are the popular types of moving averages that traders often use while shaping their trading portfolios.
This is the most basic type of moving average. It is calculated by summing up the closing prices of an asset over a specific number of periods and then dividing the total by the number of periods. This average is plotted on a chart to smooth out price data, helping traders identify the overall trend direction.
The formula to calculate a simple moving average is,
Simple Moving Average = (P1+P2+P3+.... Pn) / n
Where,
P = price of the asset for each period
n = number of periods
Weighted Moving Average(WMA) assigns different weights to various prices in the selected time frame. The WMA is a more responsive indicator than the SMA and provides better insights for traders.
The formula to calculate the weighted moving average is,
WMA = (W1xP1 + W2xP2 + W3xP3 +W4xP4 + .….WnxPn) / (W1+W2+W3+W4+... Wn)
Where,
P1, P2, P3, … Pn = The prices over the selected period.
W1+W2+W3+W4+... Wn = The weights assigned to the respective prices.
An exponential moving average provides a deeper analysis of the indicator by assigning weights to recent prices. This makes it more responsive to new information than the SMA. Therefore, the exponential moving average is particularly beneficial for traders aiming to seize short-term price shifts and swiftly adapt to emerging trends.
The formula to calculate EMA is,
EMA = Pt * [2/ (n+1)] + EMA (previous) * 1 - [2/ (n+1)]
where,
Pt = The current price or the price at the time ‘t’
n = number of periods
EMA (previous) = previous period’s EMA
This is the advanced or refined form of market analysis using moving averages. The double exponential moving average (DEMA) is designed to reduce the time lag found in traditional moving averages. DEMA combines a single EMA with an EMA of the EMA, providing a smoother and more responsive indicator. This makes it far more responsive to price changes than simple moving averages and exponential moving averages.
The Formula for DEMA is,
DEMA = 2 * EMA1 – EMA2
Here's an example with stock prices to calculate the 5-day Simple Moving Average (SMA):
Collect the closing prices for 5 days:
Day 1: ₹250
Day 2: ₹240
Day 3: ₹245
Day 4: ₹230
Day 5: ₹235
250+240+245+230+235=1200
Divide by the number of days (5): 1200/5 = 240
The 5-day SMA is ₹240.
The key differences between the Exponential Moving Average and Simple Moving Average are highlighted below.
|
Critieria |
Exponential Moving Average |
Simple Moving Average |
|---|---|---|
|
Mode of calculation |
The EMA gives more importance to recent prices, using an exponential smoothing formula. This means that recent prices have a greater impact on the average, making it more responsive to short-term price changes. |
The SMA treats all prices within the period equally, using a straightforward average calculation. It does not prioritise recent prices over older ones, resulting in a smoother but less prompt response to price movements. |
|
Responsiveness |
The EMA reacts more swiftly to changes in price, providing traders with more timely signals to respond to emerging trends or shifts in market sentiment. |
The SMA provides a primary trend direction over a given period and is less responsive to immediate price shifts. |
|
Lag |
The EMA exhibits less lag than the SMA, making it suitable for traders who need quick responses to price changes, especially in fast-moving markets. |
SMAs can have more lag, particularly when using longer periods, which may not be ideal for traders seeking immediate signals. |
|
Trend Identification |
EMA is better suited for identifying short-term trends and capturing quick price movements |
Traders using SMAs may find them more suitable for identifying long-term trends and filtering out short-term noise, making them effective for longer-term trading strategies. |
|
Use in Trading Strategies |
Traders often use EMAs for short-term trading strategies, such as scalping or day trading, where quick responses to price changes are crucial. |
SMAs are commonly used in longer-term trading strategies such as swing trading or trend following as they provide a smoother trend direction over a longer period. |
Moving averages are a fundamental tool for traders. They are an excellent means to identify trends and pinpoint potential entry and exit points for profitable trades. Understanding the calculation and the differences between various moving averages helps traders focus on the nuances of the moving average indicator, enabling a better choice based on individual trading goals and risk tolerance.
Calculate your Net P&L after deducting all the charges like Tax, Brokerage, etc.
Find your required margin.
Calculate the average price you paid for a stock and determine your total cost.
Estimate your investment growth. Calculate potential returns on one-time investments.
Forecast your investment returns. Understand potential growth with regular contributions.

You have successfully submitted your partnership request form. You will be hearing us soon!