20 Aug, 2025
 6 mins read
The Marubozu candlestick pattern is a simple yet powerful indicator in technical analysis, providing clear insight into strong buying or selling momentum during a trading session. With no wicks or shadows, it demonstrates complete control by either buyers or sellers throughout the timeframe. This pattern often appears at the start or continuation of a trend, helping traders gauge immediate price strength without the noise of intraday fluctuations. For beginners in chart reading, learning to recognize and interpret a Marubozu candle is an effective first step in understanding market sentiment.
A Marubozu candlestick is a type of candlestick pattern seen in technical analysis of stock price charts. The term "Marubozu" comes from Japanese and means "bald" or "shaven," signifying a candle with no wicks (shadows) on either end. In simpler terms, this candlestick opens at the high or low of the session and closes at the opposite extreme, indicating strong momentum throughout the trading period.
This pattern is significant because it suggests a clear sentiment in the market. When buyers dominate, a bullish Marubozu appears. When sellers take control, a bearish Marubozu is formed. It's considered one of the more straightforward patterns to identify, making it a helpful tool, especially for new traders learning price action.
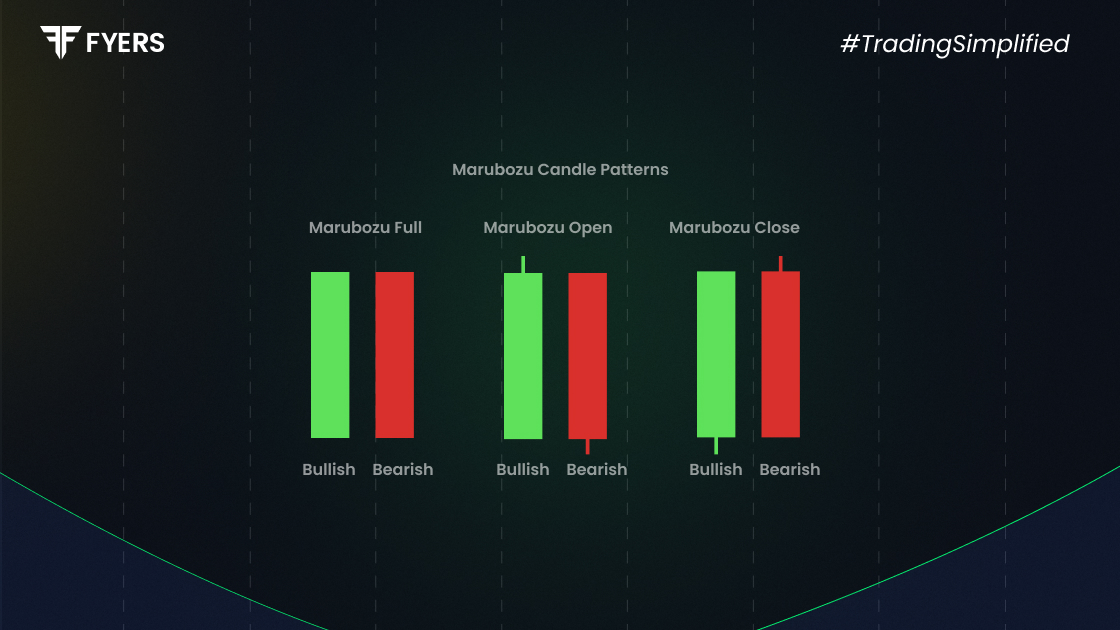
There are two primary types of Marubozu candlesticks:
Bullish Marubozu Pattern: This candle has a long body with no upper or lower shadow. It opens at the low and closes at the high, indicating strong buying interest. It is a sign that bulls dominated the market from the opening bell to the close.
Bearish Marubozu Pattern: This one also lacks wicks but opens at the high and closes at the low, showing intense selling pressure. It suggests the bears were in control throughout the session.
These patterns may appear on any timeframe but are typically more impactful on daily or weekly charts due to the broader market participation. In intraday charts, they can also be used for short-term signals, especially when combined with volume analysis.
The key features of a Marubozu candle include:
No wicks: A complete body from open to close.
Long body: Indicates strong price movement.
Directional clarity: Clearly bullish or bearish depending on colour and open/close.
Occurs at trend reversals or continuations: Depending on context, can signal either.
These features make the Marubozu a visually distinctive pattern, helping traders interpret market strength without the noise of indecision.
The Marubozu candlestick pattern is a strong indicator of market sentiment:
A bullish Marubozu suggests that buyers were in control from the open to the close. This often indicates the beginning or continuation of an uptrend.
A bearish Marubozu indicates strong selling pressure, potentially signalling the start or continuation of a downtrend.
In In both scenarios, the lack of wicks indicates minimal resistance to the prevailing price movement during that session. For instance, a bullish Marubozu that appears after a consolidation phase may signal a breakout, while a bearish Marubozu at resistance can suggest a strong rejection.
The advantages of Marubozu candlestick patterns include:
Easy to spot: With no wicks and a long body, they are visually clear.
Indicates strong sentiment: Highlights decisive market moves.
Can be used for entry signals: Especially in combination with volume and trend confirmation.
Works across timeframes: Applicable to intraday, daily, and weekly charts.
Effective in trending markets: Helps confirm trend continuation.
These factors make it a favourite among traders building a simple price-action-based strategy. It’s especially effective when supported by volume and other price action signals like breakouts or consolidations.
Despite its benefits, there are limitations to the Marubozu pattern:
Lack of context: On its own, it may not provide reliable signals.
False breakouts: Especially in low-volume situations.
Not always followed by continuation: Requires confirmation from the next candles.
No insight into volatility: Doesn’t show intraday price fluctuations.
Misleading in choppy markets: Can be invalidated quickly in sideways trends.
As with all candlestick patterns, it is essential to use the Marubozu alongside other indicators for better decision-making. Relying solely on the pattern may result in premature entries or exits.
Here’s a simple Marubozu trading strategy that beginners can consider:
Identify the pattern: Spot a bullish or bearish Marubozu on the chart.
Confirm with volume: Ensure there is high trading volume during the formation.
Look at the trend: Use trendlines or moving averages to confirm direction.
Entry point: Enter trade at the close of the Marubozu or on the break of its high/low.
Stop loss: Place a stop loss at the opposite end of the Marubozu candle.
Exit strategy: Define a risk-reward ratio, such as 1:2, or use technical levels like support/resistance.
Suppose a bullish Marubozu forms on the daily chart of a stock trading near a key support level. Volume is significantly higher than average, confirming strong buying pressure. A trader may enter at the close of the candle or wait for a slight retracement, setting the stop loss below the candle’s low. Target levels can be determined using previous highs or Fibonacci extensions.
This structured approach helps reduce emotional decision-making and improves the chances of a disciplined trade.
The reliability of the Marubozu candlestick pattern increases when:
It appears at the beginning of a new trend.
It forms near significant support or resistance zones.
It is accompanied by high volume.
It is confirmed by the following candle closing in the same direction.
However, like all price patterns, it’s not foolproof. It should be treated as one part of a broader trading plan and not relied upon in isolation. Pairing the Marubozu with tools like RSI, MACD, or moving averages improves accuracy. Also, traders should be cautious in low-volume conditions where the pattern may not reflect true sentiment.
The Marubozu candlestick pattern is a powerful tool in a trader’s technical analysis toolkit. Its simplicity and clarity make it ideal for spotting strong market moves. While it offers several advantages, especially when confirmed with volume and trend analysis, it also has its limitations. Using it with other tools like support/resistance levels and volume indicators enhances its reliability. For Indian traders learning technical analysis, the Marubozu pattern is a great starting point to understand market momentum and price action behaviour.
A Marubozu candlestick represents a strong market sentiment. A bullish Marubozu shows buyers controlled the session, while a bearish one signals sellers were in charge.
A bullish Marubozu opens at the low and closes at the high with no shadows, while a bearish Marubozu opens at the high and closes at the low.
It’s advisable to wait for confirmation from the next candle or use volume and trend indicators before taking a position.
Volume confirms the strength behind the price move. High volume supports the reliability of the Marubozu pattern.
Marubozu patterns can be used on any timeframe, but they are more reliable on higher timeframes like daily or weekly charts.
Calculate your Net P&L after deducting all the charges like Tax, Brokerage, etc.
Find your required margin.
Calculate the average price you paid for a stock and determine your total cost.
Estimate your investment growth. Calculate potential returns on one-time investments.
Forecast your investment returns. Understand potential growth with regular contributions.

You have successfully submitted your partnership request form. You will be hearing us soon!