30 Sep, 2025
 4 mins read
Candlestick patterns are one of the most popular tools in technical analysis, providing insights into market sentiment and possible price reversals. Among the many bearish reversal patterns, the Shooting Star Candlestick Pattern is a favourite for traders who wish to identify potential turning points after a rally.
This guide explains what the shooting star represents, how to identify it on charts, trading strategies, and its limitations, so traders can apply it effectively in real-world setups.
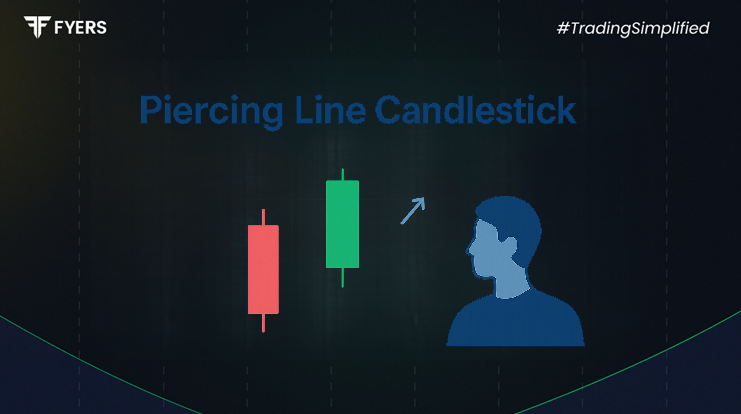
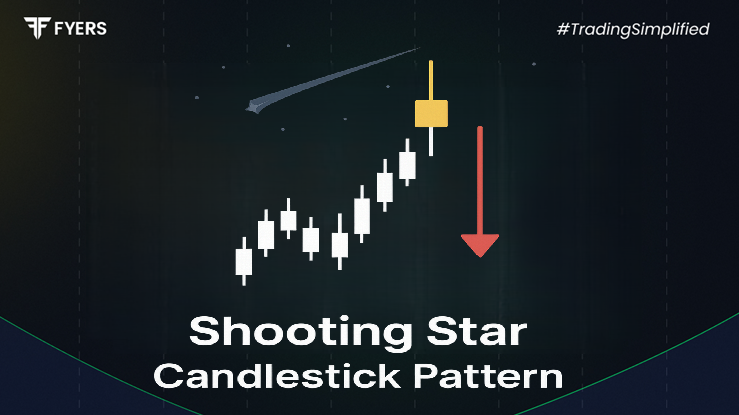
The shooting star candlestick pattern is a single-candle bearish reversal signal that appears at the top of an uptrend. It looks like a star falling from the sky, with a small body at the lower end and a long upper shadow.
Its appearance suggests that buyers tried to push prices higher, but sellers quickly regained control and forced a close near the session’s low. This change in momentum makes it a strong warning of potential downward movement.
In simple terms, a shooting stars candlestick signals that the rally may be losing steam, and the market could be preparing for a correction.
The formation of a shooting star occurs under these conditions:
Uptrend: The market must be in a bullish phase before the pattern forms.
Small real body: The candle’s real body (difference between open and close) should be small, and located near the day’s low.
Long upper shadow: The upper wick should be at least twice the size of the body, showing that buyers pushed prices up but couldn’t sustain them.
Little to no lower shadow: The closing price remains near the low of the session.
This structure creates a bearish signal because the long shadow indicates rejection of higher prices.
When looking at candlestick charts, here’s how to identify the shooting star candlestick pattern:
Appears after a visible uptrend or rally.
Has a long upper wick showing rejected highs.
The body is small and positioned near the session’s low.
Volume often increases on the formation day, confirming stronger selling pressure.
It’s worth noting that while the pattern is bearish, a green shooting star candlestick (where the close is slightly above the open) is still valid if the long upper wick and small lower body conditions are met. However, a red shooting star is generally considered more reliable because it closes below the open.
Traders use the shooting star trading strategy to anticipate market reversals and plan short entries. Here’s a step-by-step approach:
Spot the pattern after an uptrend.
Wait for confirmation: A following bearish candle or price closing below the shooting star’s low strengthens the signal.
Entry point: Traders often enter a short position once the next candle breaks below the low of the shooting star.
Stop-loss placement: A stop-loss is typically set just above the shooting star’s high to manage risk.
Target levels: Profit targets can be set at recent support zones, Fibonacci retracements, or moving average levels.
For greater accuracy, traders combine the pattern with other technical indicators like RSI, MACD, or trendline resistance.
At first glance, the inverted hammer and shooting star look similar because both have long upper wicks and small bodies. However, their context is different:
Shooting Star: Appears at the top of an uptrend and signals bearish reversal.
Inverted Hammer: Appears at the bottom of a downtrend and indicates a possible bullish reversal.
In other words, the same candle shape has opposite implications depending on where it forms in the trend.
Let’s consider some practical chart examples:
In Indian markets, a stock within the Nifty 50 index may rally to a resistance level and form a bearish shooting star. The rejection at higher levels often leads to a short-term decline.
In global indices like the S&P 500, shooting stars frequently appear during overbought phases, signalling profit-booking and trend exhaustion.
Studying historical charts can help traders see how the shooting star played out in different contexts and refine their strategy.
Despite its usefulness, the shooting star candlestick pattern has certain drawbacks:
Works best only after a strong uptrend; in sideways markets, it loses significance.
Requires confirmation from the next candles or indicators; otherwise, it may produce false signals.
May be less reliable in highly volatile markets where intraday spikes are common.
A green shooting star candlestick is weaker than a red one, making interpretation trickier.
Hence, traders should not rely on it in isolation but combine it with volume analysis and technical indicators.
The shooting star candlestick pattern is a simple yet powerful bearish reversal signal. By understanding its structure, psychology, and trading strategy, traders can use it to identify potential market tops and manage risk effectively.
However, like all candlestick patterns, it should be used alongside confirmations and other technical tools rather than as a stand-alone signal. With careful application, the shooting star can become a valuable part of any trader’s toolkit.
The shooting star is a bearish reversal pattern. It indicates that buying momentum is weakening and sellers may take control.
Yes, a green shooting star is valid if it forms after an uptrend with a long upper wick and small body. However, a red shooting star is considered stronger.
The inverted hammer forms at the bottom of a downtrend and suggests a bullish reversal. The shooting star appears at the top of an uptrend and signals a bearish reversal.
It is fairly reliable when confirmed with other indicators and price action. On its own, it may produce false signals, especially in choppy markets.
Calculate your Net P&L after deducting all the charges like Tax, Brokerage, etc.
Find your required margin.
Calculate the average price you paid for a stock and determine your total cost.
Estimate your investment growth. Calculate potential returns on one-time investments.
Forecast your investment returns. Understand potential growth with regular contributions.
Candlestick charts are one of the most widely used tools…
30 Sep, 2025
4 mins read

You have successfully submitted your partnership request form. You will be hearing us soon!